How to Measure Employee Potential: Fixing the 9-Box Grid's Weakest Axis
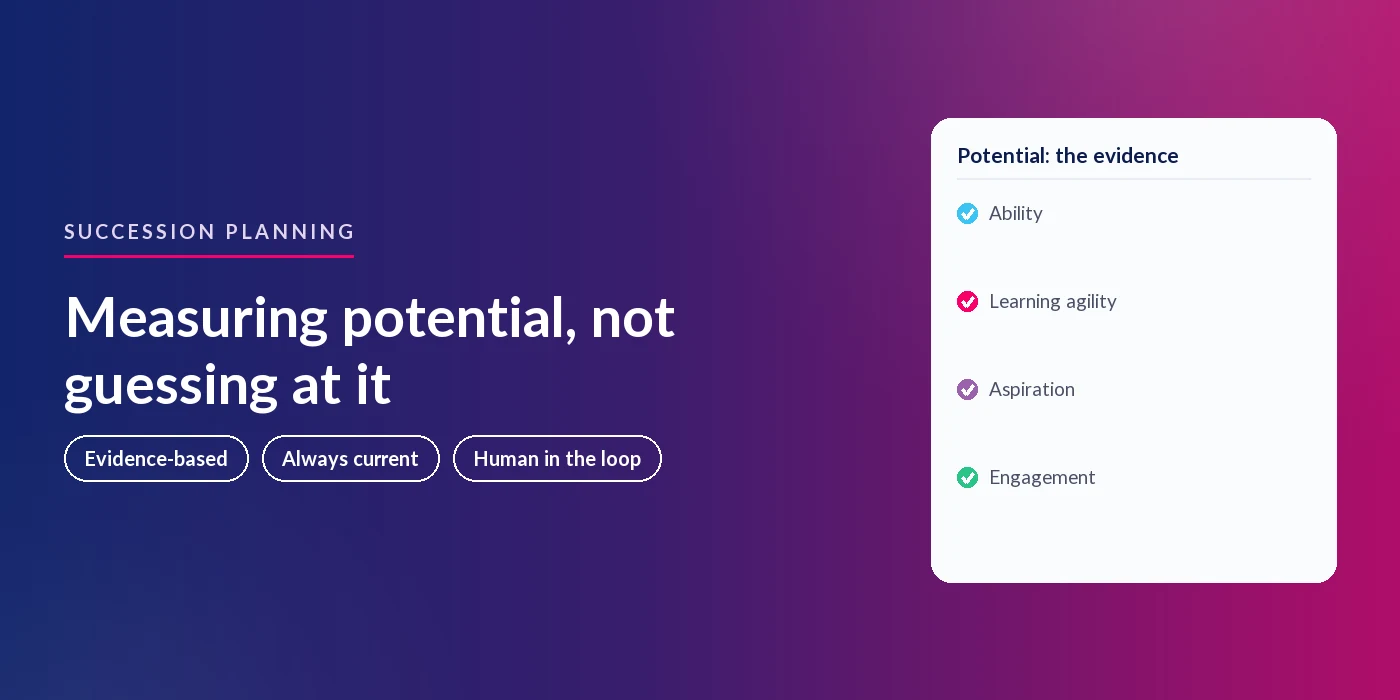
Quick answer: Measure employee potential by splitting it into defined factors, then evidencing each one separately. Most organisations use ability, aspiration and engagement, often with learning agility alongside. Evidence them with data you already generate: review scores, 360 feedback, objectives, skills assessments, training completion, recognition and recorded career conversations. Rate each factor on its own, attach the evidence to the rating, then calibrate across managers. That turns the 9-box grid's potential axis from an opinion into a measurement.
The 9-box grid plots people on two dimensions: performance across the horizontal axis, potential up the vertical. One of those axes is well served by data. The other is usually guesswork wearing a number.
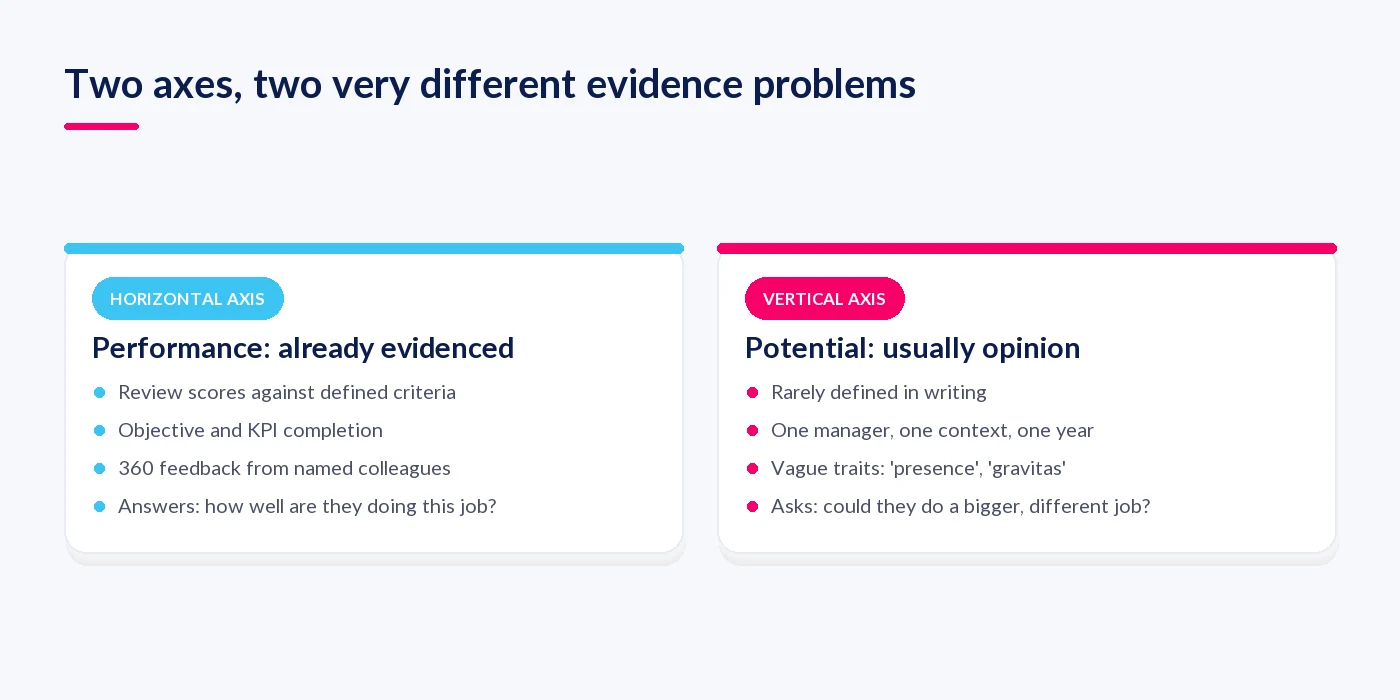
Performance has evidence behind it. Review scores against defined criteria, objective and KPI completion, 360 feedback from named colleagues. You can show your working. Potential rarely has any of that. In most calibration meetings it comes down to a manager's impression of whether someone "has it" for a bigger job.
That is a fixable problem, and you do not have to abandon the grid to fix it. This guide covers what potential actually consists of according to the research, which signals evidence each part of it, how to score and calibrate them, and where the whole exercise tends to fall apart.
Why the 9-Box Grid's Potential Axis Fails
The grid is not unpopular. It is widely used and widely distrusted at the same time. In Gallup's survey of large-company CHROs, 64% said their organisation uses the 9-box grid for succession planning, but only 9% strongly agreed it is effective for their organisation. Only 3% strongly agreed their organisation excels at selecting the right manager candidates.
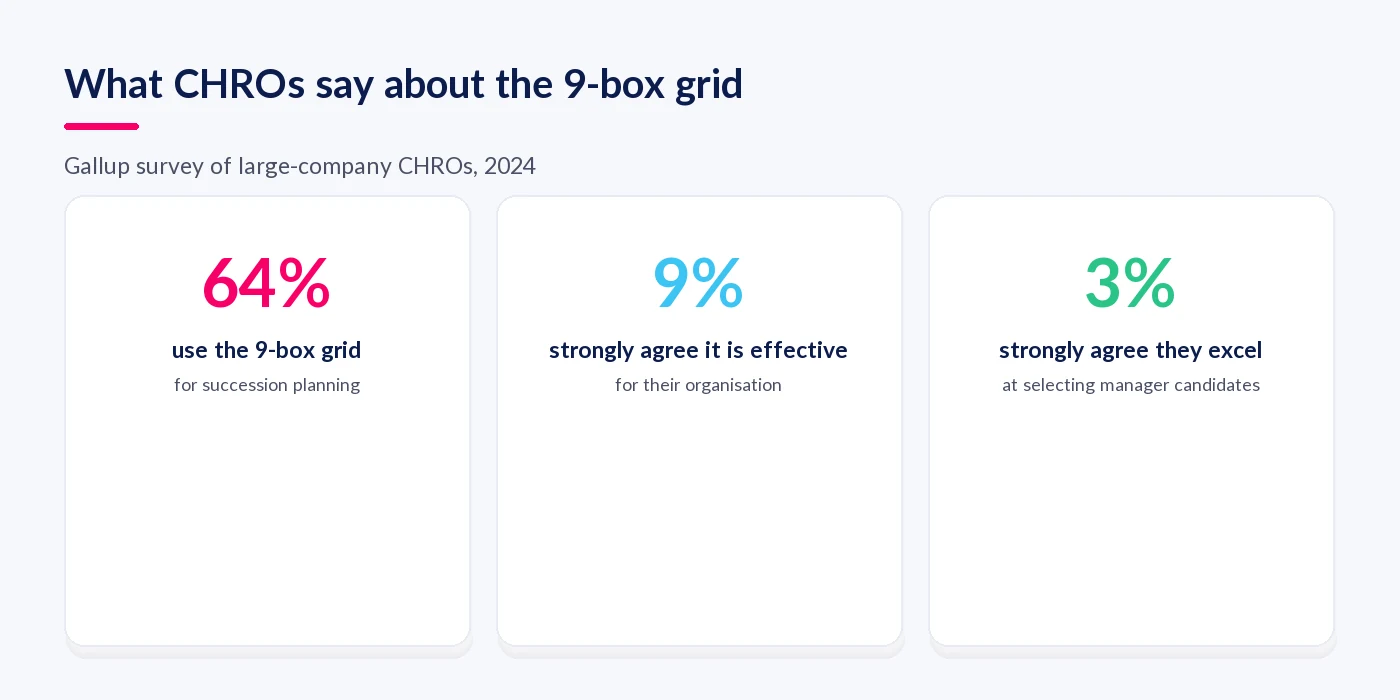
Gallup attributes much of that gap to the potential axis specifically. Three failures show up repeatedly.
Potential Gets Confused With Past Performance
Gallup's assessment is direct: the model "does not make a clear distinction between the two key dimensions", largely because "attributes in each dimension are poorly defined". When nobody has written down what potential means, managers reach for the nearest available number, which is performance. The grid then measures the same thing twice and the diagonal fills up.
This matters because the two questions are genuinely different. Performance asks how well someone is doing the job they have. Potential asks whether they could do a bigger, different job, usually with more scope, more ambiguity and more people. McCall, Lombardo and Morrison made the point in The Lessons of Experience (1988): executives who derail after promotion often do so because they keep applying the strengths that got them there instead of learning what the new role requires. Strong performance in the current role is a weak predictor of success in a different one.
Vague Criteria Let Bias In
Gallup identifies "inexact measurement of candidate potential" as one of the most common failures in selection and succession decisions, noting the criteria "are often subjective and can be influenced by interviewer biases".
Ratings built on traits like "presence", "gravitas" or "strategic thinking" have no observable anchor, so they end up rewarding visibility, similarity and confidence. The person who talks in meetings gets rated higher than the person who quietly runs the hardest team. This is not a training problem you can fix with a reminder about unconscious bias at the start of the calibration session. It is a measurement problem.
An Annual Snapshot Is Stale On Arrival
Most grids are populated once a year in a calibration meeting, then saved to a spreadsheet. People move roles, take on stretch work, close skills gaps and change their minds about their careers in far less than twelve months. A grid built in March and consulted in October is describing a workforce that has moved on.
Gallup also flags what this does to the people in the boxes: employees labelled low potential can "become discouraged and disengaged", and ambiguous box labels "obscure a candidate's real potential and undermine self-confidence". A label with no evidence behind it is hard to explain and harder to act on.
What Is Employee Potential? The Two Models That Define It
Employee potential is the likelihood that someone will succeed in a role of greater scope, complexity or seniority than the one they hold now. It is not a single trait, and the research does not treat it as one. Two decompositions dominate practice, and both break potential into parts you can observe.
The Three-Factor Model: Ability, Aspiration, Engagement
The Corporate Leadership Council three-factor model holds that high potential has three components, and that someone needs all three:
- Ability - the innate characteristics and learned skills needed to do the work, spanning cognitive ability, emotional intelligence and technical, functional and interpersonal skills.
- Aspiration - the desire to advance to more senior roles and take on more complex responsibility.
- Engagement - the commitment to stay with the organisation and to take on greater challenges.
The value of the model is what it rules out. Ability without aspiration gives you a reluctant leader who was promoted into a job they never wanted. Ability and aspiration without engagement gives you a flight risk you are about to invest a development budget in. A single blended "high potential" score hides both cases. Three separate scores expose them.
Learning Agility: How Fast Someone Learns In First-Time Conditions
The second model treats learning agility as the core of potential: the willingness and ability to learn from experience and then apply those lessons in new, unfamiliar situations. Korn Ferry assesses it across five behavioural dimensions - mental agility, people agility, change agility, results agility and self-awareness.
The supporting evidence is about career progression. Korn Ferry Institute research following district managers over a decade found that those high in learning agility received twice as many promotions over the ten-year period as those low in learning agility, with learning agility accounting for up to 18% of why a person was promoted more frequently than others, after controlling for gender and education level. Korn Ferry also reports that only 15% of the global workforce is highly agile, which is what makes it worth identifying deliberately rather than assuming it.
Why High Performance Is A Poor Proxy
Put the two models together and the reason performance data cannot stand in for potential becomes obvious. Performance evidence tells you how someone handled known conditions with known skills. Potential is a question about unknown conditions. The signal you need is not "did they hit target" but "what happened when the conditions changed".
The Four Evidence Streams A Potential Rating Needs
This is the part most guides skip. They tell you potential should be evidence-based and then leave you to work out what the evidence is. In practice each factor maps onto data your performance and development processes already produce.
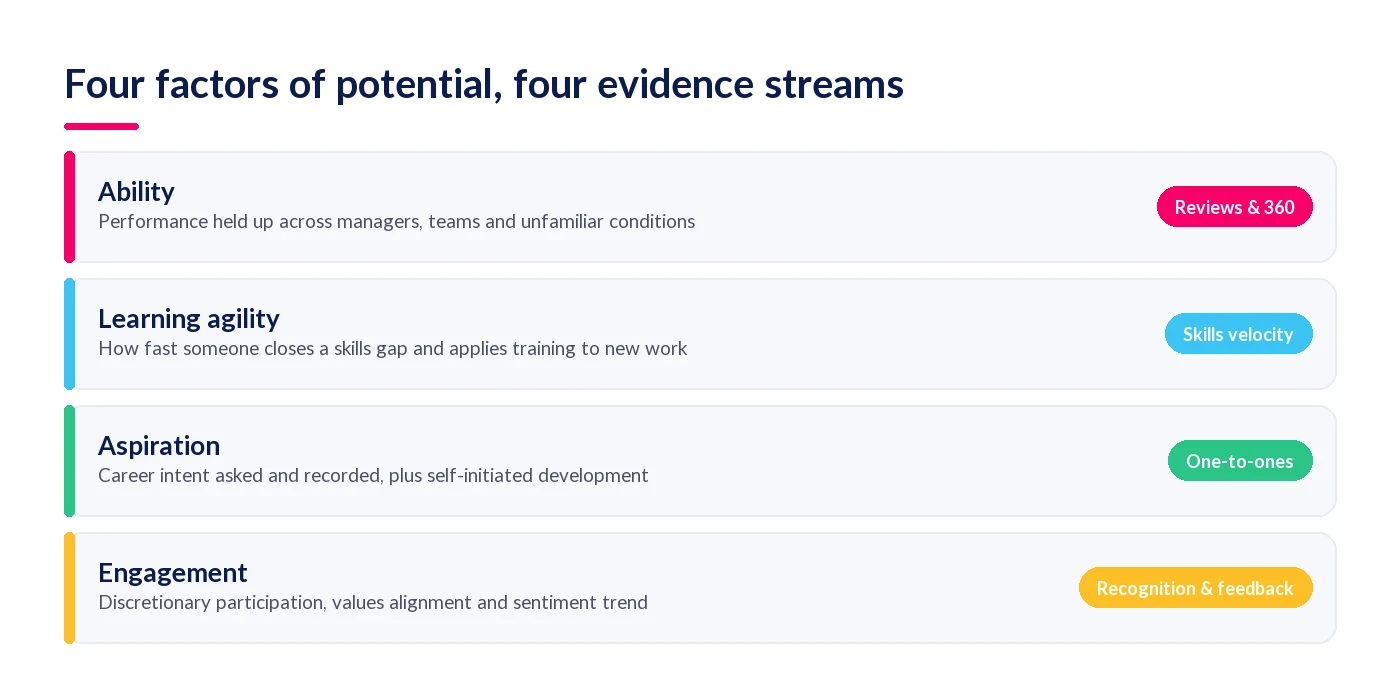
| Potential factor | What to measure | Where the evidence comes from |
|---|---|---|
| Ability Can they do it? |
Performance held up across managers, teams and unfamiliar conditions; depth against the competency framework | Review scores, 360 feedback, objective and KPI completion, competency assessments, outcomes on stretch objectives |
| Learning agility How fast do they grow? |
Speed of learning, openness to feedback, adaptability, appetite for unfamiliar work | Time from skills gap identified to gap closed, training completed and then applied, development plan progress, whether they seek feedback rather than wait for it |
| Aspiration Do they want it? |
Stated career intent, volunteering for responsibility, self-initiated development | Career questions in one-to-ones, recorded development conversations, learning started without being assigned it |
| Engagement Will they stay? |
Commitment to the organisation, discretionary participation, values alignment | Recognition given and received, feedback and review participation rates, values-linked feedback, sentiment trend over time |
Two things are worth noticing here. First, almost none of this requires a new survey. It is a by-product of running performance management and development properly. Second, the aspiration row is the one most organisations have nothing for, because nobody ever asks the question and records the answer.
How To Measure Employee Potential In Four Steps
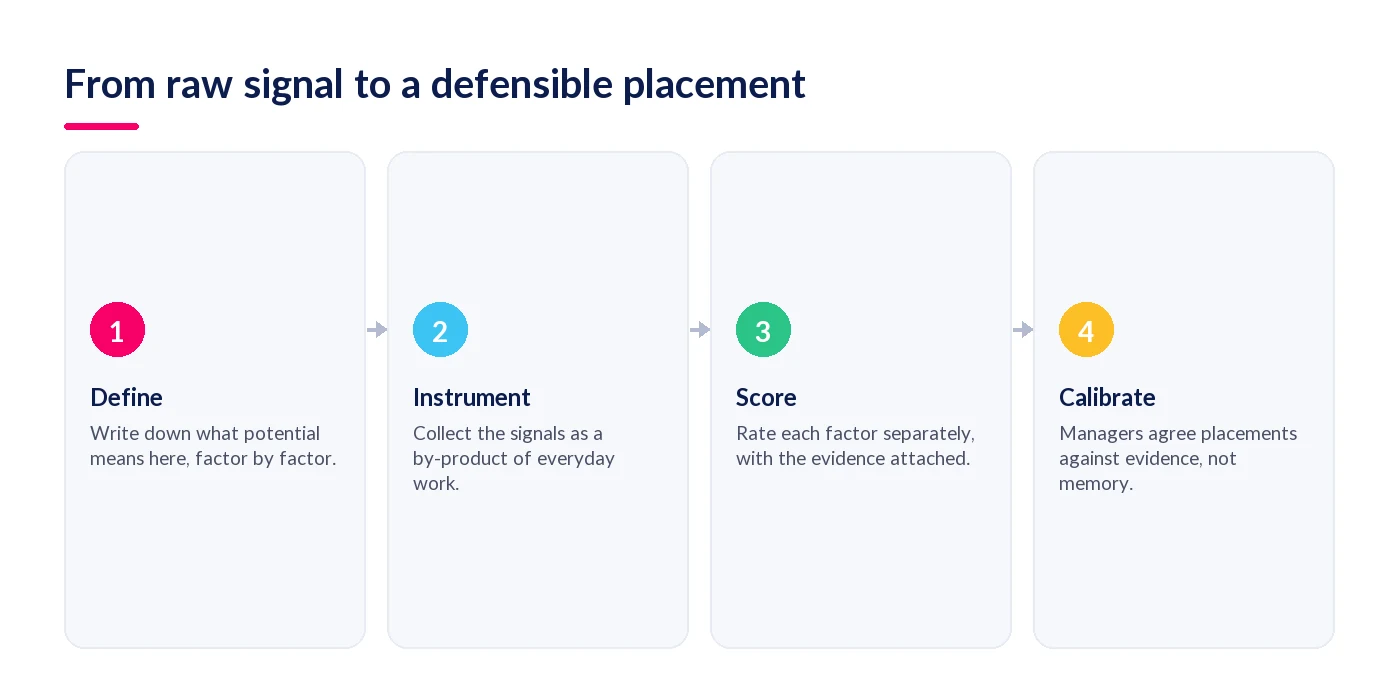
1. Define Potential In Writing Before You Rate Anyone
Pick your model and write down what each factor means in your organisation, with observable indicators. "Learning agility" is not a definition. "Closed two or more identified skills gaps in the last twelve months and applied the new capability to live work" is. Gallup's recommendation is to modify the grid to include a composite measure of potential rather than a single subjective judgement, and a composite needs named components.
Keep the list short. Four factors with three or four indicators each is enough. Anything longer will not survive a calibration meeting.
2. Instrument The Signals So Collection Is A By-Product Of Work
If measuring potential requires a separate annual data-gathering exercise, it will be done badly once and then quietly dropped. The signals need to accumulate on their own: reviews and 360s on their normal cycle, objectives tracked as they complete, skills assessed against a competency framework, training recorded when finished, recognition captured when given, career intent asked in one-to-ones as a standing question.
Add the aspiration question explicitly to your one-to-one template. It is the cheapest improvement available to most talent processes, and it stops you developing people towards jobs they do not want.
3. Score Each Factor Separately, Never As One Number
Rate ability, learning agility, aspiration and engagement independently, each with its evidence attached. Then read the pattern rather than averaging it. High ability with low aspiration is a specialist to invest in where they are, not a succession candidate. High ability and aspiration with falling engagement is a retention conversation this month. Averaging those into "moderate potential" throws away the only useful information in the assessment.
Only once you have the factor scores should you place someone on the vertical axis, and the placement should be traceable back to them.
4. Calibrate Against Evidence, Not Memory
Calibration works when managers have to justify placements with concrete examples, and fails when it becomes a negotiation between people defending their own teams. Run it with the evidence on the table: this rating, these signals, this period. Any placement a manager cannot evidence gets moved or parked, not waved through.
Record the reasoning alongside the placement. A year later you need to know why someone was rated as they were, both to review the decision and to have a defensible conversation with the employee.
Where Measuring Potential Breaks Down
Nobody Ever Asks About Aspiration
Aspiration is the one factor that cannot be inferred from behaviour with any confidence. Someone taking on extra work might be ambitious or might be unable to say no. The only reliable method is asking and recording the answer, then asking again, because career intent changes with life circumstances. Organisations that skip this end up promoting people into roles they resent.
One Manager, One Context
A potential rating drawn entirely from one manager's view of one role in one year is a rating of that relationship as much as that person. Ability is supposed to be about performance holding up across contexts, which means you need input from more than one source. 360 feedback, cross-team objectives and project work under different leads all count. If the only evidence you have comes from a single line manager, say so rather than treating the rating as robust.
Deskless And Frontline Workers Leave Less Of A Trail
Signal-based measurement quietly favours people who work at a desk in front of a system all day. Field engineers, care staff, retail and manufacturing teams generate fewer digital signals, so an evidence-led approach can systematically underrate them unless you deliberately close the gap - mobile check-ins, recognition that works from a phone, competency sign-off at the point of work. Otherwise you have replaced one bias with a more defensible-looking one.
The Grid Becomes The Decision
A box is a prompt for a conversation, not a verdict. Once placements start driving pay, promotion and investment automatically, the incentive shifts to managing the rating rather than developing the person. Keep the human decision explicit and keep the grid as what it is good at: a shared frame for a talent conversation.
Keep The Grid, Fix The Inputs: Success Circles Alongside The 9-Box
The 9-box grid asks the right question. It is familiar, it fits on a slide and it gives a board a way to discuss talent in ten minutes. The problem was never the frame. It was what gets fed into the vertical axis.
Success Circles™ are StaffCircle's answer to that input problem. They collect and distil activity from across the platform - reviews, 360 feedback, objectives, one-to-ones, recognition, awards, development plans and training - into a live picture of each person across performance, development and engagement. Those are the same ingredients the research says a potential rating needs. The grid stays as the calibration and communication frame; Success Circles become the measurement engine behind it.
Performance Signals Evidence Ability
Review scores, objective and KPI completion and 360 feedback build a picture of consistency across managers, teams and conditions, rather than one strong quarter under one supportive boss. That is the evidence base for ability, and it is the part most organisations already have.
Development Signals Proxy Learning Agility
Skills validated against the competency framework, training completed and then applied, gaps closed, stretch objectives taken on. Skills velocity - how quickly someone moves from gap identified to capability demonstrated - is the closest observable proxy for learning agility you can get from operational data rather than a psychometric.
Engagement And Culture Signals Cover The Rest
Recognition given and received, feedback and review participation, values-linked feedback and sentiment trend give you engagement directly, and a behavioural window on aspiration alongside the career questions captured in one-to-ones.
Humans Still Make The Call
Nothing here places anyone on a grid automatically. Managers still decide, in calibration, with the evidence pack in front of them. StaffCircle's AI capabilities are ISO/IEC 42001:2023 certified, the AI management system standard, and are designed to keep a human in the loop on people decisions. Asking "who is ready to step up if we lose a team lead?" should return evidence, not a verdict.
| Dimension | 9-box grid alone | 9-box grid plus Success Circles |
|---|---|---|
| Potential axis input | Manager opinion, calibrated annually | Continuous evidence across ability, agility, aspiration and engagement |
| Data source | Point-in-time manager and HR judgement | Everyday signals from reviews, 360s, objectives, recognition, development and training |
| Bias exposure | High - vague labels and subjective traits | Reduced - defined factors evidenced over time, then calibrated by humans |
| Currency | A snapshot, stale soon after the meeting | Current, and comparable month by month or year by year |
| Actionability | A label with little detail behind it | Named development actions, flight-risk flags, ready-successor and bench-strength views |
| Employee experience | Boxed privately, with labels nobody can explain | An evidenced view built on real contribution that employees can see |
Reading is free. So is knowing your number. Calculate what structured performance management would return for your organisation.
Run the calculator →A 30-Day Plan To Put Evidence Behind Your Potential Axis
You do not need a new system to start. You need a definition and a habit.
- Days 1-5: Write your definition of potential. Pick the factors, write two or three observable indicators for each, and get your leadership team to agree the wording.
- Days 6-12: Audit what you already hold against each factor. You will usually find good ability evidence, thin learning-agility evidence and nothing at all on aspiration.
- Days 13-18: Add the aspiration question to your one-to-one template and brief managers on recording the answer. Set up skills-gap tracking so closure has a date attached.
- Days 19-25: Re-rate one department against the new factor definitions, scoring each factor separately with evidence attached, and compare the result with last year's grid. The people who move are the interesting ones.
- Days 26-30: Run a calibration session under the new rule: no placement without evidence. Capture the reasoning against each placement.
If you want a fuller framework, our succession planning guide with customisable templates covers the surrounding process, and the Beyond the 9-Box webinar walks through the calibration side in detail.
Final Thoughts
The 9-box grid is not the problem. Rating half of it on evidence and half of it on impression is the problem, and it is why so few of the organisations using the grid believe it works. Define what potential means, evidence each factor from data you already generate, score the factors separately and make managers show their working in calibration. The grid stays useful. The vertical axis starts meaning something.
If you want to see what an evidenced potential axis looks like on your own data, book a demo and we will walk through Success Circles with your performance, development and engagement signals. You may also find our guides on identifying high-potential employees and connecting succession and performance management useful, or the argument for succession planning without the 9-box grid if you would rather replace the frame than fix it.
Frequently Asked Questions
How do you measure employee potential objectively?
Break potential into defined factors - commonly ability, aspiration and engagement, often with learning agility alongside - and write observable indicators for each. Then evidence each factor from data you already collect: reviews, 360 feedback, objectives, skills assessments, training records, recognition and recorded career conversations. Score the factors separately with the evidence attached, and calibrate across managers so no placement stands without justification.
What is the difference between performance and potential?
Performance is how well someone does the job they currently hold, measured against defined criteria for that role. Potential is the likelihood they will succeed in a bigger or different role, with more scope, complexity or ambiguity. Performance evidence describes known conditions and known skills; potential is a judgement about unfamiliar conditions, which is why strong current performance is a weak predictor of success after promotion.
Why is the 9-box grid's potential axis considered unreliable?
Because it is usually rated on manager impression rather than defined criteria. Gallup found that only 9% of large-company CHROs strongly agree the 9-box grid is effective for their organisation, despite 64% using it, and points to inexact measurement of potential, poorly defined attributes in each dimension and subjectivity open to bias as the causes.
Should we stop using the 9-box grid?
Not necessarily. The grid is a good frame for a talent conversation: familiar, quick to read and easy to present to a board. The weakness is the input to the potential axis, not the frame itself. Fixing the inputs is usually a smaller change than replacing the tool, and it keeps the shared language your managers already understand.
What are the three factors of high potential?
The Corporate Leadership Council model defines high potential as ability, aspiration and engagement, and holds that someone needs all three. Ability covers the innate characteristics and learned skills needed to do the work. Aspiration is the genuine desire to advance to a more senior, more complex role. Engagement is the commitment to stay and to take on greater challenges.
What is learning agility and how do you assess it?
Learning agility is the willingness and ability to learn from experience and apply those lessons in new, unfamiliar situations. Korn Ferry assesses it across five dimensions: mental agility, people agility, change agility, results agility and self-awareness. Operationally, the closest proxy is speed - how quickly someone moves from an identified skills gap to demonstrated capability, and whether they apply training to work that differs from what they were trained on.
Does learning agility actually predict career progression?
Korn Ferry Institute research following district managers over ten years found those high in learning agility received twice as many promotions across the period as those low in learning agility, with learning agility accounting for up to 18% of why someone was promoted more often than peers, after controlling for gender and education. Korn Ferry also reports that only 15% of the global workforce is highly agile.
How often should potential ratings be reviewed?
Formal calibration once or twice a year is normal, but the evidence behind the ratings should be current continuously. An annual placement is out of date within months because people change roles, close skills gaps and change their career intentions. If the underlying signals accumulate automatically, you can revisit a rating whenever something material changes rather than waiting for the cycle.
How do you reduce bias in potential assessments?
Replace trait ratings with observable indicators, require evidence for every rating, take input from more than one manager or context, score each factor separately instead of blending them, and record the reasoning behind each placement so it can be reviewed later. Check the results for patterns by demographic and by working pattern, since evidence-led approaches can still underrate people who generate fewer digital signals.
Can you measure potential for frontline and deskless workers?
Yes, but not by accident. Field, care, retail and manufacturing teams generate fewer digital signals than office-based staff, so you need to close the gap deliberately: mobile check-ins and one-to-ones, recognition that works from a phone, and competency sign-off recorded at the point of work. Without that, an evidence-based method will systematically underrate the people furthest from a desk.
What data does StaffCircle use to evidence potential?
Success Circles draw on activity across the platform - reviews, 360 feedback, objectives and KPIs, one-to-ones, recognition and awards, development plans, competency assessments and training records - and distil it into a live view of each person across performance, development and engagement. Those map onto the ability, learning agility, aspiration and engagement factors that the research says a potential rating needs.
Does AI make the potential decision in StaffCircle?
No. The platform surfaces and summarises evidence; managers decide placements in calibration. StaffCircle's AI capabilities are ISO/IEC 42001:2023 certified, the AI management system standard, and are built to keep a human in the loop on people decisions. Asking who is ready to step up should return the evidence for a conversation, not an automated verdict.
Related articles

See StaffCircle in action
Book a personalised demo and see how StaffCircle drives performance, engagement and development.