Succession Planning Metrics: How to Tell If Your Plan Works
Claire is HR director at a 600-person food manufacturer. She has run talent reviews for three years, and every critical role on her spreadsheet has a name next to it. Then the chair asks a simple question in a board meeting: “If our operations director left tomorrow, who would be doing the job on Monday?”
The spreadsheet says three people. In practice, one of them is already the named successor for two other roles, one has never run a site, and the third resigned in the summer. The plan looked complete. Nobody had ever measured whether it worked.
Claire is a composite, but most HR teams I talk to have had a version of that meeting.
Succession planning metrics are the measures that tell you whether a succession plan would actually hold if a critical role fell vacant. The useful set is small: critical role coverage, net bench strength (each successor counted once), ready-now coverage, development-action completion, the share of vacancies filled by a named successor, how those successors perform after the move, and the diversity of the pipeline.
Which questions should your succession numbers answer?
Start with the questions, not a list of KPIs. A metric that answers none of these is noise. A board or auditor will ask some version of:
- Do we have someone named for every role we could not afford to leave empty?
- How many different people are actually in our pipeline, rather than how many names?
- If two critical roles fell vacant in the same month, could we fill both?
- Are the people we named getting the development we promised them?
- When a critical role did fall vacant, did the plan get used?
- Did the people we promoted succeed in the job?
- Does our pipeline look like the organisation we want, or like our current leadership team?
If your company reports against the UK Corporate Governance Code, some of these questions are already being asked of you. Provision 17 of the 2024 Code says the nomination committee should “ensure plans are in place for orderly succession to both the board and senior management positions, and oversee the development of a diverse pipeline for succession.” Provision 23 asks the annual report to describe the committee’s “approach to succession planning and how both support developing a diverse pipeline”. Neither the Code nor the FRC’s guidance defines a single metric, so the measures are yours to choose.
The CIPD’s succession planning factsheet is similar. It defines succession planning as “identifying and growing talent to fill business-critical positions in the future” and stresses objective assessment, but it does not offer a measurement set either. That gap is why every vendor list looks different.
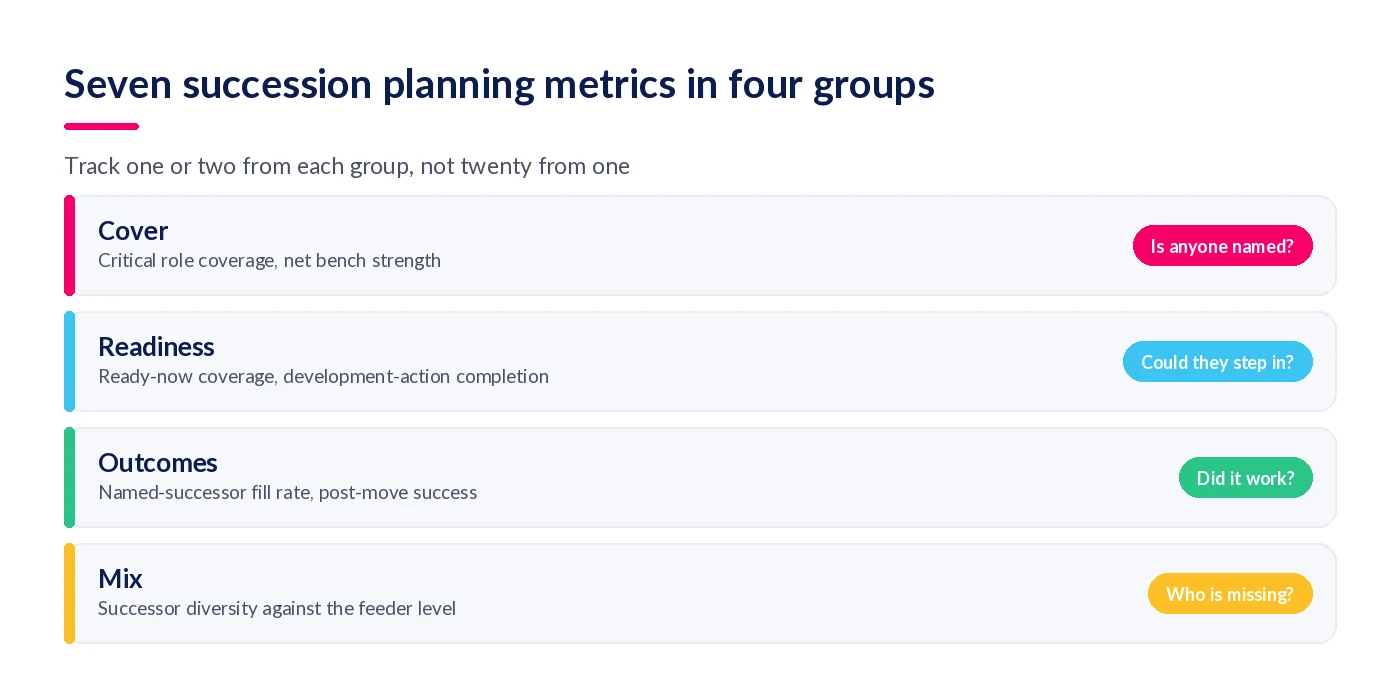
The seven succession planning metrics, with formulas
Each metric below has a definition, a formula and a note on what it misses. Use the same reporting period and the same list of critical roles for all of them, or the numbers will not reconcile.
1. Critical role coverage
The share of critical roles with at least one named successor. Formula: critical roles with one or more named successors ÷ total critical roles × 100. It is the easiest number to produce and the easiest to flatter, because a single name, however unready, counts as covered.
2. Net bench strength
How deep your pipeline is once each person is counted once. Formula: unique successors ÷ successor slots needed × 100, where slots needed is critical roles × the number of successors you want per role. Its partner, gross bench strength, divides all successor names by the same slots. The gap between the two is the single most revealing number in this post, and the next section explains why.
3. Ready-now coverage
The share of critical roles that could be filled today by someone rated ready now, with each ready-now person allocated to one role only. Formula: critical roles matched to a distinct ready-now successor ÷ total critical roles × 100. ISO’s succession planning metrics cluster, ISO/TS 30433:2021, includes the mirror image of this: a “positions without ready candidates rate”.
4. Development-action completion
Whether successors are getting the development that is supposed to make them ready. Formula: successor development actions completed by their due date ÷ successor development actions due in the period × 100. This is your leading indicator. If it is low, ready-now coverage will not improve next year, whatever the talent review says.
5. Named-successor fill rate (and internal fill rate)
When a critical role actually fell vacant, how often did a named successor get it? Formula: critical vacancies filled by a named successor ÷ critical vacancies in the period × 100. The broader internal fill rate counts any internal appointment. ISO/TS 30433 calls that the succession effectiveness rate, “the percentage of critical positions that are occupied by internal promotions versus external hires”, and gives 70% to 80% only as an example of a rate that “can be regarded as a sign of good succession effectiveness.” Track both. A high internal fill rate with a low named-successor fill rate means you are promoting from within, just not from your plan.
6. Post-move success
Whether the people you moved into critical roles succeeded. Formula: internal appointees to critical roles still in post and meeting their performance standard 24 months after appointment ÷ internal appointees who reached 24 months × 100. Why 24 months? It matches the window in one of the better-known studies of internal moves. Matthew Bidwell’s 2011 study of an investment bank found that “workers promoted into jobs have significantly better performance for the first two years than workers hired into similar jobs”, even though external hires were paid around 18 percent more. It is one firm, at all levels rather than senior roles only, so treat it as a reason to measure, not a benchmark.
7. Successor diversity
Whether the pipeline reflects the people who could be in it. Formula: share of a group among unique successors, compared with that group’s share of the feeder level (usually the layer below the critical roles). Comparing with the feeder level matters. Comparing with the current leadership team tells you only that the pipeline looks like the people already at the top, which is the problem the Code’s “diverse pipeline” wording is aimed at.
Why your coverage figure is probably flattering you
Here is the counting problem almost nobody talks about. In most succession plans, a handful of strong managers are named on several slates. Every one of those entries is counted as cover. But a person can only step into one role at a time.
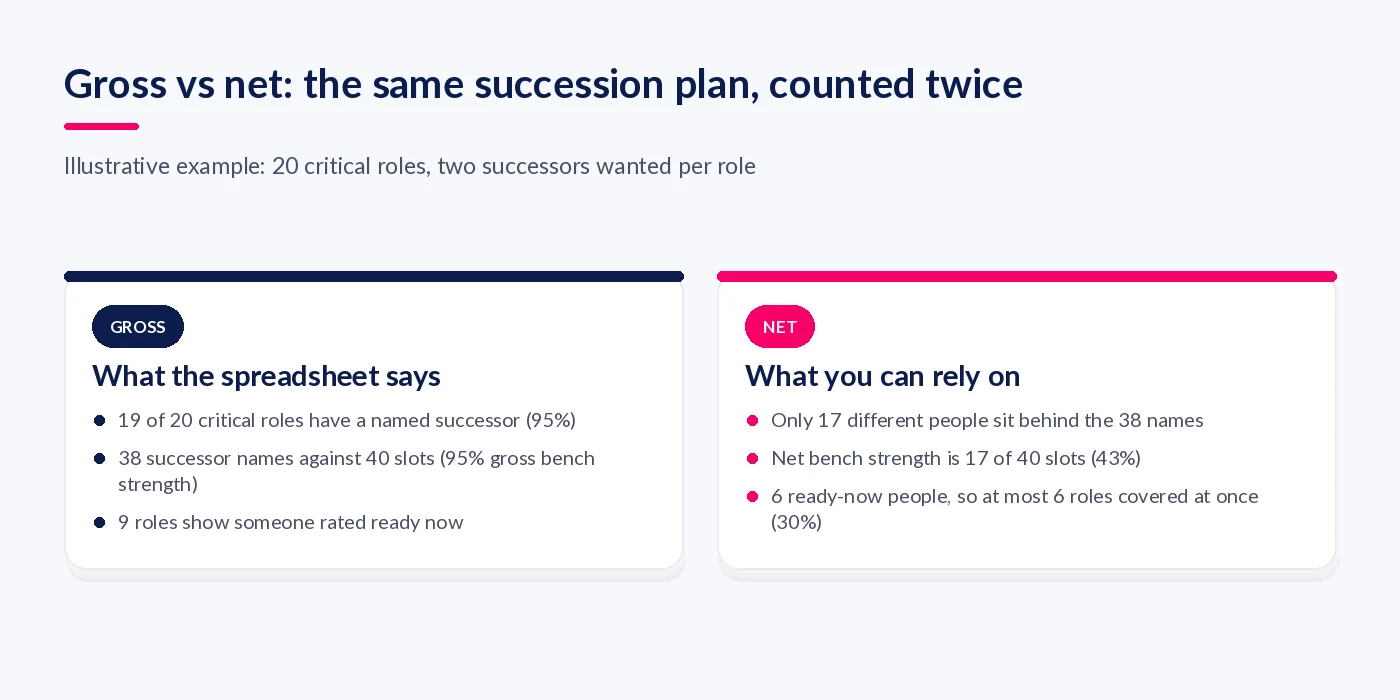
Take an illustrative organisation with 20 critical roles and a target of two successors per role, so 40 slots. The talent review produces 38 successor names. Gross bench strength is 38 ÷ 40, or 95%, and 19 of the 20 roles have a name, so coverage is 95% too. It looks like a finished plan.
Now de-duplicate. Only 17 different people sit behind those 38 names. Net bench strength is 17 ÷ 40, or 43%. Nine roles show someone rated ready now, but there are only six ready-now people, so at most six roles could be filled at once. Ready-now coverage is 30%, not 45%.
Standards do not settle this either. ISO/TS 30433’s successor coverage rate is “the number of employees in the leadership succession pool per total number of leaders”, which divides by all leaders, not critical roles. The same standard warns that “used in isolation, singular metrics can provide a limited or distorted view of the process.” Pick your definitions, write them down, and keep them stable from one report to the next.
How do you build a succession scorecard?
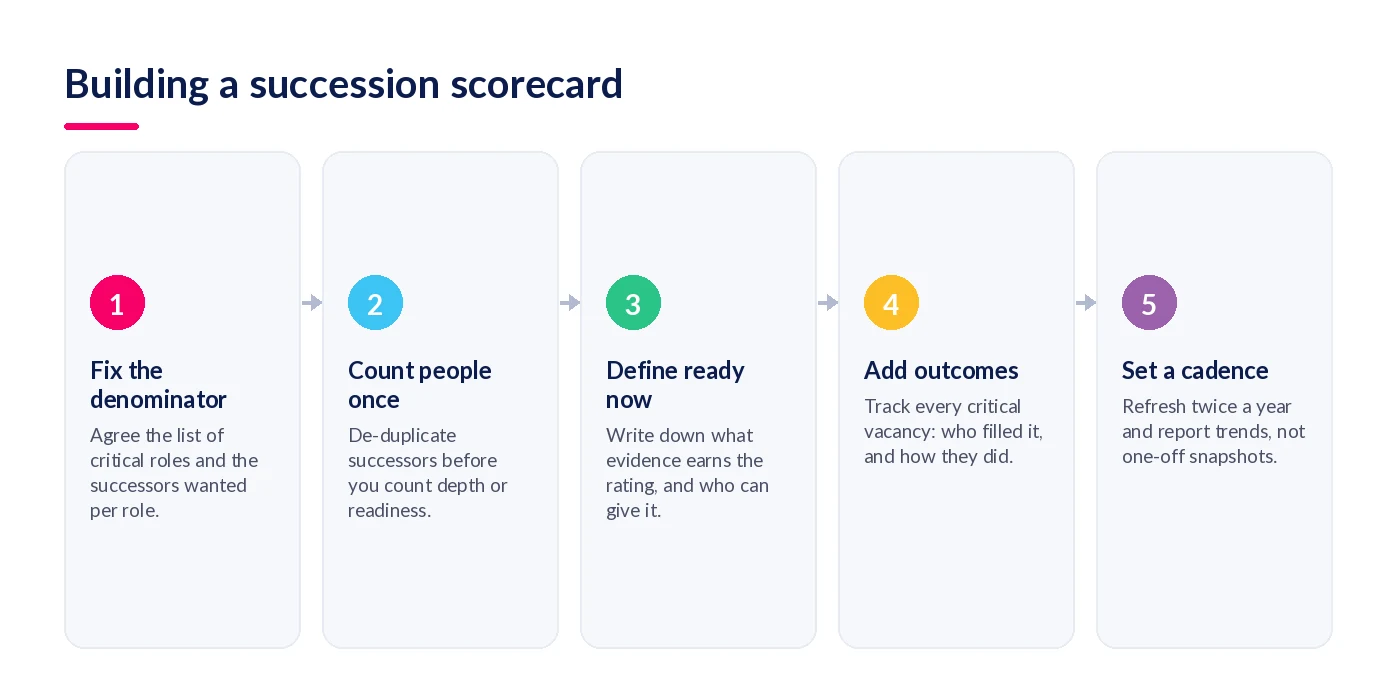
You need a fixed list, a rule for counting people, and a habit of logging what happens when someone leaves. Five steps get you there.
- Fix the denominator. Agree the list of critical roles and how many successors you want for each, and freeze it for the reporting period.
- Count each person once. De-duplicate successors before you calculate depth or readiness, so one strong manager named on four slates counts once.
- Write down what ready now means. Define the evidence that earns a ready-now rating and who is allowed to give it.
- Log every critical vacancy. Record who filled each critical role that fell vacant, whether they were a named successor, and how they were doing 24 months later.
- Report trends twice a year. Refresh the numbers at each talent review and show the movement since last time, not a single snapshot.
Step three is where most plans quietly fall apart. If “ready now” means “the line manager likes them”, the number will drift upwards every year. A better rule: ready now means the person has shown the role’s critical competencies in their current job, has covered at least part of the role, and has been rated by someone other than their own manager. Our post on succession readiness ratings goes further into calibrating that.

A worked example: one scorecard, end to end
Back to Claire’s illustrative 20 critical roles. Over the last 12 months she logged 52 development actions for successors, six critical vacancies and five internal appointments that have now passed the 24-month mark. Women make up 41% of the feeder level and 4 of her 17 unique successors. Here is what her first honest scorecard looks like.
| Metric | Calculation | Result | What it tells the board |
|---|---|---|---|
| Critical role coverage | 19 ÷ 20 | 95% | Almost every role has a name |
| Net bench strength | 17 unique ÷ 40 slots | 43% | The pipeline is thin and concentrated |
| Ready-now coverage | 6 distinct ready-now ÷ 20 | 30% | Two simultaneous exits would hurt |
| Development-action completion | 29 on time ÷ 52 due | 56% | Readiness will not improve at this pace |
| Named-successor fill rate | 3 ÷ 6 vacancies | 50% | The plan was used half the time |
| Internal fill rate | 4 ÷ 6 vacancies | 67% | One internal move came from outside the plan |
| Post-move success at 24 months | 4 ÷ 5 appointees | 80% | Internal moves mostly work |
| Successor diversity (women) | 4 of 17 (24%) vs 41% feeder | −17 points | Women are under-nominated |
That is a very different story from “95% of critical roles have a successor”. Internal moves mostly succeed, which is what matters most. But depth is thin, development is slipping and the pipeline does not reflect the feeder level: three specific fixes, each with a number that can move by the next review.
Claire’s fixes: name at least one successor per role who is not on another slate, re-date the overdue development actions, and look again at un-nominated women in the feeder level. The succession planning guide and templates include a slate layout you can adapt for this.
Where succession measurement goes wrong
Measuring activity instead of outcomes
Number of talent reviews held, number of plans completed and number of high-potentials identified are activity counts. They show effort, not whether the plan worked. ISO/TS 30433 makes a related point about its own effectiveness rate: it shows talent processes worked “only after the fact”. You need both kinds, but outcomes belong at the top of the report.
Changing the critical role list mid-year
Add five roles and coverage drops; remove three and it jumps. Neither tells you anything about the pipeline. Freeze the list for each reporting period and show changes separately. If you are not sure the list is right, our guide to identifying critical roles gives you a scoring method.
Letting ready-now ratings inflate
Ratings given by a single manager, with no evidence attached, drift upwards. A sharp rise in ready-now coverage with no matching rise in development-action completion is the warning sign. Ask what changed.
Never closing the loop on vacancies
Many organisations measure the plan and never check what happened when someone left. If you do one thing after reading this, start logging every critical vacancy: who got it, whether they were on the plan, and how they were doing two years later. That log is the only evidence that the plan works.

How StaffCircle helps you measure succession
A spreadsheet works for a while. The hard part is keeping it current and tying readiness to evidence.
Readiness tied to competencies
StaffCircle’s competency frameworks describe what each critical role needs, so a ready-now rating can be checked against the competencies a successor has actually shown rather than a manager’s instinct.
Development actions you can count
Through Skills & Development, each successor’s skills gaps and development plan sit in one place, which is where your development-action completion rate comes from.
A pipeline that comes from everyday work
Success Circles™ build a picture of performance, potential and development from everyday activity on the platform, as an alternative to the 9-box grid. That helps you find successors outside the usual names, which is how net bench strength and pipeline diversity improve.
Reporting without rebuilding the spreadsheet
Because reviews, objectives and development live in the same platform, workforce analytics can report on the people data behind your scorecard, rather than someone rebuilding it before each board meeting.
Final thoughts
The question a board will eventually ask is not “do we have a succession plan?” It is “would it work?” Answer that with a small set of honest numbers: count each successor once, define ready now in writing, and log what happens when critical roles fall vacant. If you would like to see how StaffCircle keeps that picture live, book a demo.
FAQ
What are succession planning metrics?
Succession planning metrics are measures that show whether a succession plan would work if a critical role fell vacant. The core set is critical role coverage, net bench strength, ready-now coverage, development-action completion, named-successor fill rate, post-move success and successor diversity.
How do you measure the success of a succession plan?
Measure outcomes as well as the plan itself. Track how often critical vacancies are filled by a named successor, and whether those people are still in post and meeting their performance standard after 24 months. Coverage and bench strength tell you the plan exists; outcomes tell you it works.
What is bench strength in succession planning?
Bench strength is how deep your pipeline of successors is for critical roles. Gross bench strength counts every successor name against the slots you need. Net bench strength counts each person once, which is the more honest figure because one person cannot fill two roles at the same time.
How do you calculate bench strength?
Multiply your critical roles by the number of successors you want per role to get the slots needed. Gross bench strength is successor names divided by slots needed. Net bench strength is unique successors divided by slots needed. Both are usually shown as percentages.
What is the difference between gross and net bench strength?
Gross bench strength counts every time a person is named as a successor. Net bench strength counts each person once. If the same strong manager is named for four roles, gross bench strength counts them four times, which makes the pipeline look deeper than it is.
What is succession plan coverage?
Succession plan coverage is the share of critical roles that have at least one named successor. It is a useful starting point, but on its own it can flatter a plan, because a role counts as covered even when the only named successor is not ready or is named for several other roles.
What is a ready-now successor?
A ready-now successor is someone who could step into a critical role today with no more than normal onboarding. The rating is most reliable when it is backed by evidence of the role’s critical competencies and agreed by someone other than the person’s own line manager.
How many successors should each critical role have?
There is no standard number. Many organisations aim for two, often one ready now and one ready later, but the right number depends on how risky and hard to fill the role is. Whatever you choose, set it per role and use it as the denominator for bench strength.
What is a good internal fill rate for critical roles?
There is no universal benchmark. ISO/TS 30433 gives 70% to 80% only as an example of good succession effectiveness. More useful is comparing your internal fill rate with your named-successor fill rate, which shows whether internal appointments are coming from your plan or around it.
How often should succession plans be reviewed?
Most organisations review succession plans at least once a year, and twice a year is common for critical roles. Refresh the metrics at each review and report the movement since the last one, because trends tell a board more than a single snapshot.
Which succession metrics should be reported to the board?
Keep it to a handful: critical role coverage, net bench strength, ready-now coverage, named-successor fill rate, post-move success and pipeline diversity. Boards reporting under the UK Corporate Governance Code are asked to describe their approach to succession planning and how it supports a diverse pipeline.
Is there an ISO standard for succession planning metrics?
Yes. ISO 30414 lists succession planning metrics as part of human capital reporting, and ISO/TS 30433:2021 sets out the succession planning metrics cluster in more detail, including succession effectiveness, successor coverage and readiness rates. The full texts are paid-for standards.
Related articles



See StaffCircle in action
Book a personalised demo and see how StaffCircle drives performance, engagement and development.