The Complete Guide to One-to-One Check-In ROI
Take a 400-person logistics business. Call it Northfield. Forty managers, an average salary of £32,000, and turnover running at 28%, which is 112 leavers a year. The HR director wants to move every manager to a recorded fortnightly one-to-one and needs the finance director to fund the platform and the time. The finance director asks the only question that matters to them: what is a one-to-one worth?
Most answers to that question are a vendor's number with a dollar sign in front of it. This guide builds the answer from the ground up, with UK sources and the date of every figure, and then shows how to measure whether the return actually turned up. We will carry Northfield through the whole thing.

The ROI of one-to-one check-ins comes from three places: turnover that does not happen, absence and lost productivity that fall as engagement rises, and manager time that is spent on conversation rather than admin. Poor check-ins reduce employee engagement because the manager is the largest single influence on it, and the one-to-one is where that influence is exercised. Measuring the return means tracking the cadence and quality of conversations as leading indicators, then reading engagement, absence and regretted attrition by team as the outcomes, and pricing the difference with your own salary data.
The Cost Side: What Poor Check-Ins Cost a UK Employer
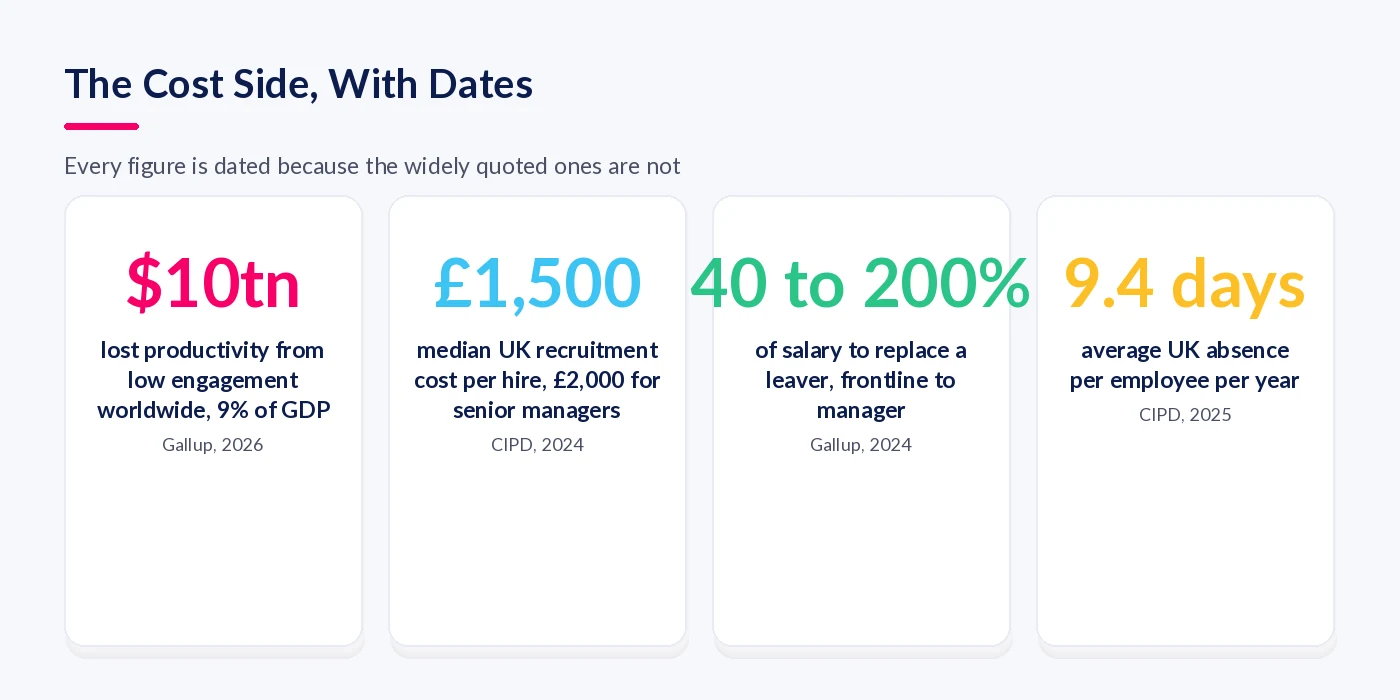
Start with what disengagement costs, and be suspicious of any figure without a date. The "£340 billion a year" that circulates in UK articles is a 2022 vendor estimate. Gallup's State of the Global Workplace 2026 is the current primary source: global engagement fell to 20% in 2025, its lowest since 2020, and low engagement cost the world economy approximately $10 trillion in lost productivity, or 9% of GDP. The UK country data puts engagement here at 10%.
Turnover
Three figures, three very different sizes, and you need to know which one you are using. The CIPD's Resourcing and Talent Planning 2024 survey puts the median cost of recruiting an employee at £1,500, and £2,000 for a senior manager. That is recruitment only: advertising, agency fees and in-house time. Gallup's 2024 analysis estimates full replacement cost, including lost output while the new person gets up to speed, at 40% of salary for frontline staff, 80% for technical professionals and 200% for leaders and managers. And the £30,614 per leaver you will see quoted on UK HR sites, including an older post of ours, comes from an Oxford Economics study for Unum published in 2014, covering £25,000-plus earners in five sectors. It is twelve years old. Use it only with that label.
For Northfield, with 80 frontline, 24 technical and 8 managerial leavers a year, the recruitment-only cost is about £168,000 and the Gallup full-replacement cost is about £2.15 million. Both are true; they measure different things. Put both in front of the finance director.
Absence
The CIPD's Health and Wellbeing at Work 2025 survey reports average absence of 9.4 days per employee per year, the highest in more than fifteen years, with mental ill health the leading cause of long-term absence. The ONS's Labour Force Survey figure is lower, at 4.4 days per worker in 2024, because it is self-reported. Use your own absence data if you have it. Northfield's 400 people at nine days each is 3,600 days a year, worth roughly £500,000 at a daily salary cost of £140.
Productivity
Gallup's Q12 meta-analysis compares top- and bottom-quartile teams on engagement: 14% to 18% higher productivity, 23% higher profitability, 78% less absenteeism and 21% to 51% less turnover. These are differences between quartiles of teams, not what one initiative delivers, so use them to size the prize rather than to forecast the result.
The Mechanism: How Check-Ins Move Those Numbers
The link from one-to-ones to the cost lines above is the manager. Gallup finds the manager accounts for at least 70% of the variance in team engagement, and that employees whose managers hold regular meetings with them are almost three times as likely to be engaged. Its 2024 work is more specific: one meaningful conversation a week with each direct report makes employees four times as likely to be highly engaged, and 45% of people who left voluntarily had no proactive conversation about their satisfaction, performance or future in their last three months. Forty-two percent said the organisation could have done something to keep them.
Microsoft's workplace analytics study matched calendar data to engagement surveys at two Fortune 100 companies and found that employees who got twice the one-to-one time of their peers were 67% less likely to be disengaged, while those whose manager never met them one-to-one were four times as likely to be disengaged. On the UK side, the CIPD's analysis of UK Working Lives found 45% of employees with a very poor relationship with their line manager expected to quit within a year, against 14% with a very good one.
Three numbers to distrust
Because the cost side attracts big figures, it is worth naming the ones to leave out of a board paper. The "£340 billion cost to the UK economy" is a 2022 estimate from an employee-benefits vendor, not a government or academic figure, and the "£6,480 per disengaged employee" that travels with it has no traceable method. Adobe's often-cited 30% fall in voluntary turnover after it replaced annual reviews with check-ins is a company self-report from 2012 to 2013, with no control group. And the "86% of highly engaged organisations use regular one-to-ones, against 50% of disengaged ones" figure comes from a survey vendor's own product page. None of these is necessarily wrong. None of them will survive a finance director who asks where it came from, which is why the figures in this guide carry dates and primary links.
Which patterns to look for when the conversations are going wrong is a separate question, covered in the signs poor one-to-ones are hurting engagement. Here the point is narrower: turnover is where the money is, the manager conversation is the lever, and the lever is measurable.
The Measurement Stack
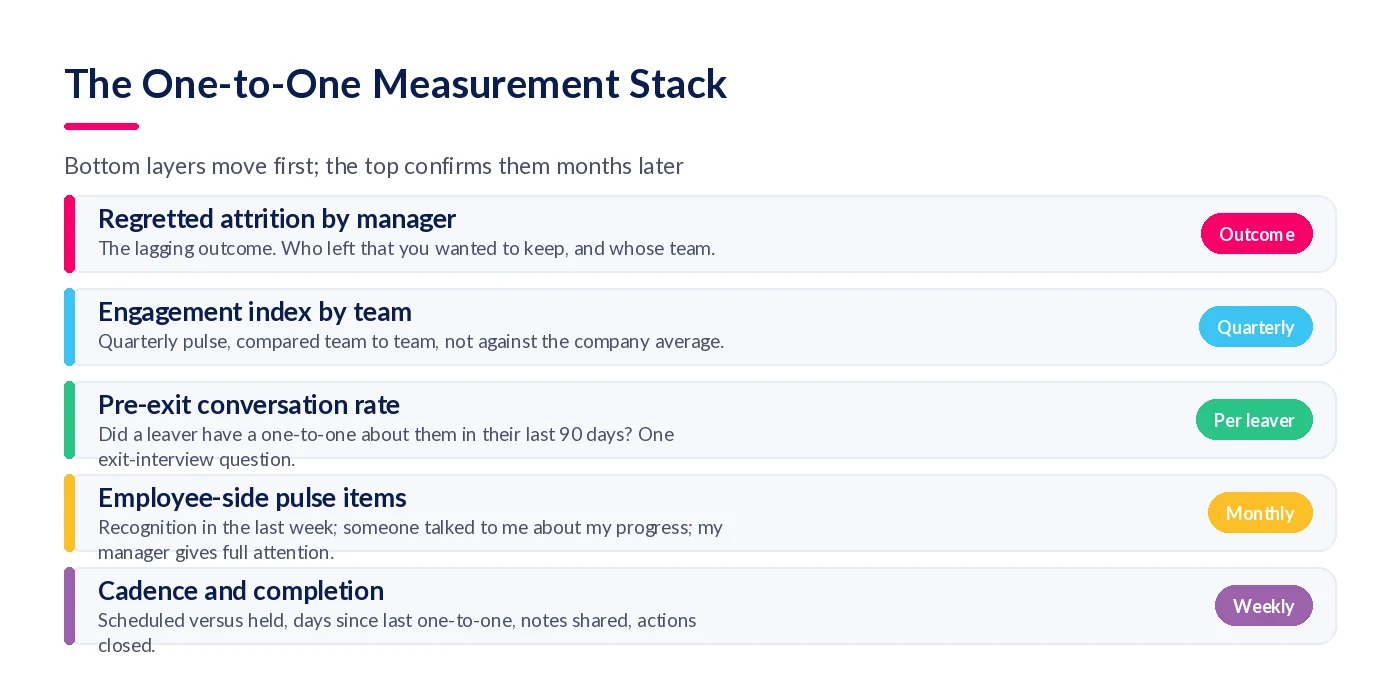
You cannot measure the ROI of one-to-ones by comparing this year's engagement score with last year's. Too much else changed. What works is a stack of metrics from leading to lagging, read by team so that differences between teams do the attribution for you.
Cadence and completion (weekly)
Scheduled versus held, days since each employee's last one-to-one, whether a note was shared, whether actions from last time were closed. 15Five defines check-in completion as the percentage of employees completing their manager check-in in a period; Lattice's admin analytics report meeting frequency and participation rate. Whatever your platform calls it, this is the input you control, so it is measured first and most often.
Employee-side pulse items (monthly)
Three questions, borrowed in spirit from Gallup's Q12 without copying its proprietary wording: I received recognition for good work in the last week; someone has talked to me about my progress recently; my manager gives me their full attention in our one-to-ones. These move within a quarter of a cadence change, which is what makes them useful. If you want a UK-validated alternative, the CIPD's people management research uses items on whether the manager can be relied on to keep promises, is supportive when there is a problem and treats people fairly, which are free to use and map well onto what a good one-to-one does.
Pre-exit conversation rate (per leaver)
One question in every exit interview: when did you last have a one-to-one that was about you rather than the work? Gallup's 45% is the benchmark you are trying to beat. Report it by manager.
Engagement index by team (quarterly)
Your existing survey, cut by team and compared team to team. Our guide to measuring employee engagement covers eNPS, participation and the index calculation, so we will not repeat it.
Regretted attrition and absence by manager (the outcome)
Who left that you wanted to keep, and how many days were lost, by team, over twelve months. This is the number the board understands and the last one to move. Google's Project Oxygen used exactly this pairing, manager behaviours from surveys against team results and turnover, to prove that manager quality was worth investing in.
A Worked Example: Northfield, 400 People
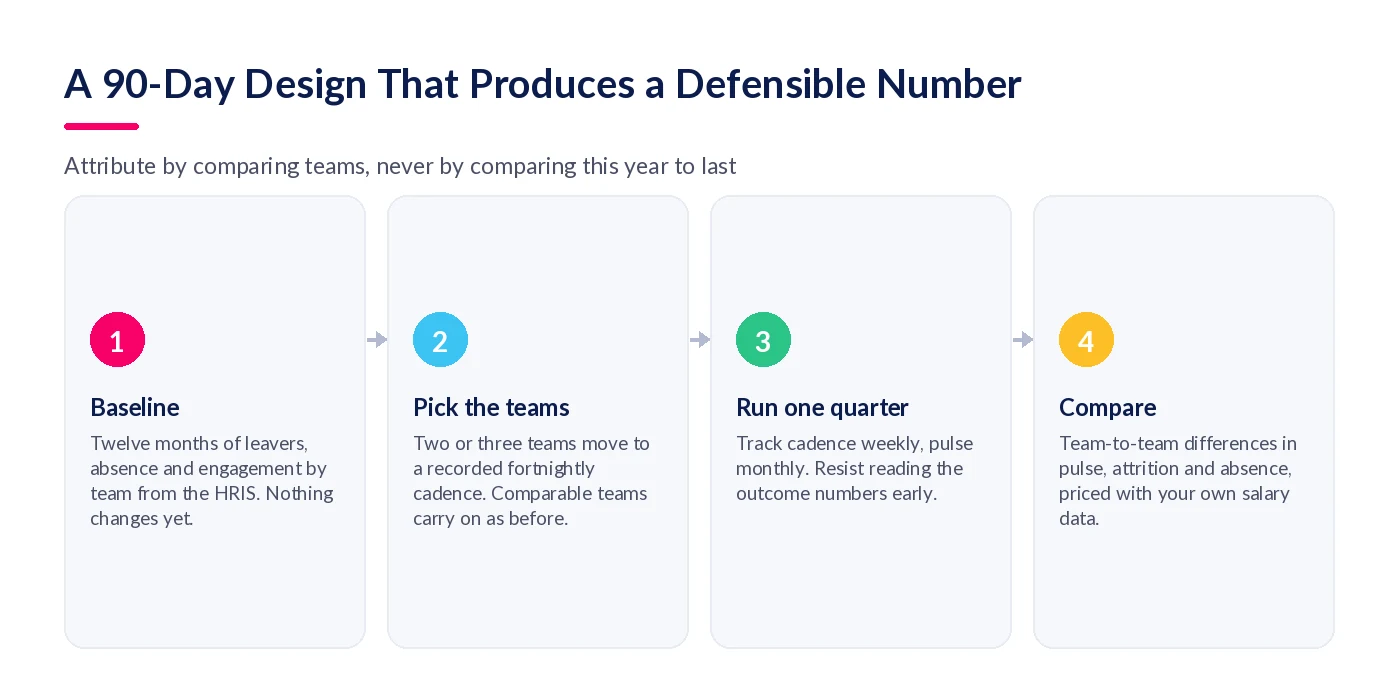
Northfield runs a 90-day design. Baseline first: twelve months of leavers, absence and engagement by team from the HRIS. Then three depots move to a recorded fortnightly one-to-one with a shared template, and three comparable depots carry on as they were. Cadence is tracked weekly and the three pulse items monthly.
The cost side is straightforward and worth stating plainly, because it is smaller than people expect.
| Line | Assumption | Annual figure |
|---|---|---|
| Manager time | 40 managers, 26 one-to-ones a year per report, 30 minutes, roughly 10 reports each, £25 an hour | £130,000 of time already in the diary, redirected rather than added |
| Employee time | 400 people, 26 meetings, 30 minutes, £16 an hour | £83,000, same caveat |
| Platform | 400 employees at £3.85 per employee per month, billed annually | £18,480 plus set-up |
| Turnover saved, conservative | Turnover falls five points, 20 fewer leavers, CIPD recruitment cost only | £30,000 |
| Turnover saved, full replacement | Same 20 leavers at Gallup's blended replacement cost of about £19,200 | £384,000 |
| Absence | Absence falls 10% in the pilot depots, scaled to the whole business | About £50,000 |
The break-even is worth stating too. The platform costs Northfield £18,480 a year. At the CIPD recruitment-only figure, it pays for itself if the cadence prevents thirteen departures across 400 people, a three-point fall in turnover. At Gallup's full replacement cost, it pays for itself if it keeps one manager or two technical specialists who would otherwise have left. Put that way, the question for the finance director is not whether one-to-ones return more than they cost. It is which of those two thresholds they find credible, and the pilot exists to settle it.
Two honest observations. Most of the "cost" is time that managers already spend, or should already spend, so the incremental cash cost is the platform and set-up. And the return has a wide range, from £30,000 to over £400,000, depending entirely on which replacement-cost figure you accept. That range is the argument for the 90-day design: it replaces an assumption with Northfield's own number. If the pilot depots lose five fewer people than the comparison depots over the quarter, Northfield knows what a one-to-one is worth in its own salary data, and the finance director stops arguing about Gallup.
Using the StaffCircle ROI Calculator
If you want the model without the spreadsheet, our ROI calculator runs a version of it for your headcount. It asks for five inputs: number of employees, number of managers, annual turnover rate, current engagement rate and average salary. It then computes three savings lines, and it is worth knowing exactly what they are.
Productivity savings are employees multiplied by average salary multiplied by 1.5%, a deliberately conservative fraction of the productivity gap Gallup reports between engaged and disengaged teams. Manager time savings are the number of managers multiplied by £1,700 a year, which is the admin time StaffCircle customers report recovering per manager from automated reviews and objectives. Turnover savings assume each departure costs a third of salary, apply your turnover rate against the 17% average turnover StaffCircle customers report, and scale the result by the engagement uplift customers see, an average of 74%. The calculator produces a report you can hand to finance, and you can override the defaults with the numbers from your own baseline.
Treat the output as a sized prize rather than a forecast, for the same reason the Q12 quartile figures are a prize rather than a forecast. Then run the 90-day design to turn it into your own number.
Two practical notes on using it. Enter your actual turnover and engagement rates rather than accepting the defaults, because the turnover line is sensitive to both and the defaults describe a global average, not you. And if your engagement rate is already high, the uplift is capped at 100%, so the calculator will understate the turnover line for well-run organisations rather than flatter them; that is deliberate. For Northfield, at 28% turnover and a typical UK engagement rate, the calculator's turnover line lands between the two figures in the table above, which is roughly where you would expect a blended replacement cost to sit.

Records, SARs and Why Documentation Is Part of the Return
One line the ROI models leave out is risk. Acas says it is important to keep a written record of what is discussed in performance conversations and to share it with the employee, and that employers should keep a record of any conversation about performance problems. The ICO's guidance for employers on subject access requests gives "Can I have a copy of the notes from my last appraisal?" as an example of a valid request, with one month to respond, and notes that workers are especially likely to make one during grievance, disciplinary or dismissal proceedings.
Recorded one-to-ones therefore do two jobs. They are the leading indicator in the measurement stack, and they are the evidence base if a performance case is challenged. A manager who has held and shared twelve dated one-to-ones in the year before a capability process is in a very different position from one who has not, and the cost of the second position is not in any calculator. The Employment Rights Act 2025, which cuts the unfair dismissal qualifying period to six months from January 2027, makes that record more valuable still, particularly for frontline teams, as we set out in the frontline continuous feedback guide.
Where StaffCircle Fits
StaffCircle is built to make the measurement stack a by-product of running one-to-ones properly rather than a separate project.
The cadence layer is automatic
One-to-ones are scheduled and recorded on the employee's record with objectives, feedback and recognition, and reporting shows completion and overdue check-ins by manager and team, so the base of the stack is measured without anyone building a spreadsheet.
The employee side is in the same place
Pulse surveys, eNPS and sentiment analysis in the Engagement module give you the monthly items and the quarterly index, cut by the same teams as the cadence data.
The record writes itself
Notetaker records a one-to-one, summarises key points, decisions, actions and sentiment, aligns it to the right record and shares the summary with attendees, so the documentation that protects the organisation and the sentiment data that feeds the model come from the same ten-minute conversation. Custom Insights and Power BI reporting put attrition and absence next to cadence by team, which is the comparison the 90-day design depends on.
Final Thoughts
The finance director's question has a good answer, but it is not a single number from a vendor. It is a range built from dated UK sources, narrowed to your own figure by a team-to-team pilot, and reported through a stack that starts with whether the conversations are happening at all. Do that once and the case for one-to-ones stops being an HR belief and becomes a line in the management accounts. Run your headcount through the ROI calculator to size the prize, then book a demo to see how StaffCircle measures the return as you go.
FAQ
What is the ROI of employee engagement?
The financial return from higher engagement, usually measured through lower turnover, lower absence and higher productivity. Gallup's Q12 meta-analysis finds top-quartile teams have 21% to 51% less turnover, 78% less absenteeism and 14% to 18% higher productivity than bottom-quartile teams, and its 2026 report puts global lost productivity from low engagement at about $10 trillion, or 9% of GDP.
How do you calculate the ROI of one-to-one meetings?
Price the cost of manager and employee time plus any platform, then measure the change in regretted attrition, absence and engagement between teams that adopted a recorded cadence and comparable teams that did not, over at least a quarter. Convert fewer leavers into pounds using either recruitment cost (CIPD median £1,500) or full replacement cost (Gallup: 40% to 200% of salary), and state which you used.
How much does disengagement cost UK businesses?
There is no reliable current UK-specific total. The widely quoted £340 billion is a 2022 vendor estimate. Gallup's 2026 report puts the global cost of low engagement at approximately $10 trillion a year in lost productivity, 9% of GDP, and UK engagement at 10%, so a proportionate UK share would be large but the honest answer is to calculate it for your own organisation.
How much does it cost to replace an employee in the UK?
Recruitment alone has a median cost of £1,500 per hire, or £2,000 for senior managers, according to the CIPD's 2024 survey. Full replacement cost including lost output is far higher: Gallup estimates 40% of salary for frontline roles, 80% for technical professionals and 200% for managers. The often-quoted £30,614 comes from a 2014 Oxford Economics study and should be labelled as such.
How do you measure the effectiveness of one-to-one meetings?
Track cadence and completion weekly (held versus scheduled, notes shared, actions closed), ask employees monthly about recognition, progress conversations and manager attention, add a pre-exit conversation question to exit interviews, and read the engagement index, absence and regretted attrition by team quarterly. Compare teams to each other rather than the company to last year.
What is a good one-to-one completion rate?
There is no published industry benchmark. A practical target is that 90% or more of scheduled one-to-ones are held within the period, that no employee goes more than three weeks without one, and that every held meeting has a shared note. Microsoft's analytics found the average manager gave each report 30 minutes every three weeks, so beating that average is a reasonable first goal.
How often should managers have one-to-ones, and how long should they be?
Gallup recommends one meaningful conversation a week with each direct report, lasting 15 to 30 minutes, and finds it makes employees four times as likely to be highly engaged. Fortnightly works for established, autonomous staff; monthly is the outer limit. Frequent short conversations beat infrequent long ones.
Should one-to-ones be documented?
Yes. Acas says it is important to keep a written record of what is discussed and to share it with the employee afterwards, and to keep a record of any conversations about performance problems. Documented one-to-ones are also the leading indicator in any ROI measurement, so the record serves both purposes.
Are one-to-one notes personal data under UK GDPR?
Yes. Notes about an identifiable employee are personal data, and the ICO treats appraisal and performance notes as employment records. Employees can request them through a subject access request, which must be answered within one month, so notes should be accurate, held centrally and written on the assumption the employee will read them.
What survey questions measure manager effectiveness?
Google's Project Oxygen used upward feedback on behaviours such as coaching, empowering without micromanaging and supporting career development. Gallup's Q12 includes items on recognition in the last week, someone caring about you as a person and someone talking to you about your progress. The CIPD's UK research uses items on whether the manager keeps promises, is supportive with problems and treats people fairly.
How long before one-to-one changes show up in engagement scores?
Cadence and completion change immediately. Employee pulse items on recognition and attention typically move within a quarter. Team engagement indices need a full survey cycle, and regretted attrition and absence need six to twelve months of data to be read with confidence, which is why the model uses leading indicators first.
What does the StaffCircle ROI calculator actually calculate?
Three lines from five inputs. Productivity savings are employees multiplied by average salary multiplied by 1.5%. Manager time savings are the number of managers multiplied by £1,700 a year of recovered admin time. Turnover savings assume a departure costs a third of salary, compare your turnover rate with the 17% average StaffCircle customers report, and scale by the 74% average engagement uplift customers see.
How does absence data fit into an engagement ROI model?
Absence is one of the three cost lines, alongside turnover and productivity. Use your own days-lost data by team, priced at daily salary cost, and compare pilot teams with comparison teams. For context, the CIPD reports UK average absence of 9.4 days per employee in 2025 and the ONS Labour Force Survey reports 4.4 days per worker in 2024; the gap reflects employer versus self-reported data.
Can AI notetakers help measure one-to-one quality?
Yes, within data protection limits. A notetaker that records and summarises each one-to-one produces a consistent record of whether recognition, priorities and development were discussed, plus sentiment over time, which is otherwise invisible to HR. Employees must be told the meeting is recorded, the summary should be shared with them, and a person should check it before it becomes the record.
Related articles
See StaffCircle in action
Book a personalised demo and see how StaffCircle drives performance, engagement and development.