How to Measure Employee Engagement
The standard way to measure employee engagement is to combine three numbers from one survey — an employee net promoter score, a participation rate and an engagement index — and read them against behavioural data you already hold, such as absence and voluntary turnover by team. All three are simple arithmetic, shown below with worked figures.
Key facts
- eNPS is the percentage of promoters minus the percentage of detractors.
- Participation rate is responses divided by eligible employees, not by total headcount.
- An engagement index is favourable answers divided by total answers given.
- A score by team is actionable; a company average almost never is.
- Three cycles of trend beat one precise reading, every time.
How do you measure employee engagement
You ask a fixed set of questions on a fixed scale, at a fixed interval, and you calculate the same three numbers each time. Those three — eNPS, participation rate and an engagement index — cover the headline, the credibility of the headline, and the detail underneath it. Anything you add beyond them should answer a question you can name in advance.
The single most common measurement mistake is treating the score as the output. The score is the input to a comparison: this team against that team, this quarter against last. A standalone engagement index of 69% means nothing on its own. The same figure, down eight points in one department and flat everywhere else, is a specific, actionable finding.
How do you calculate eNPS, participation rate and an engagement index?
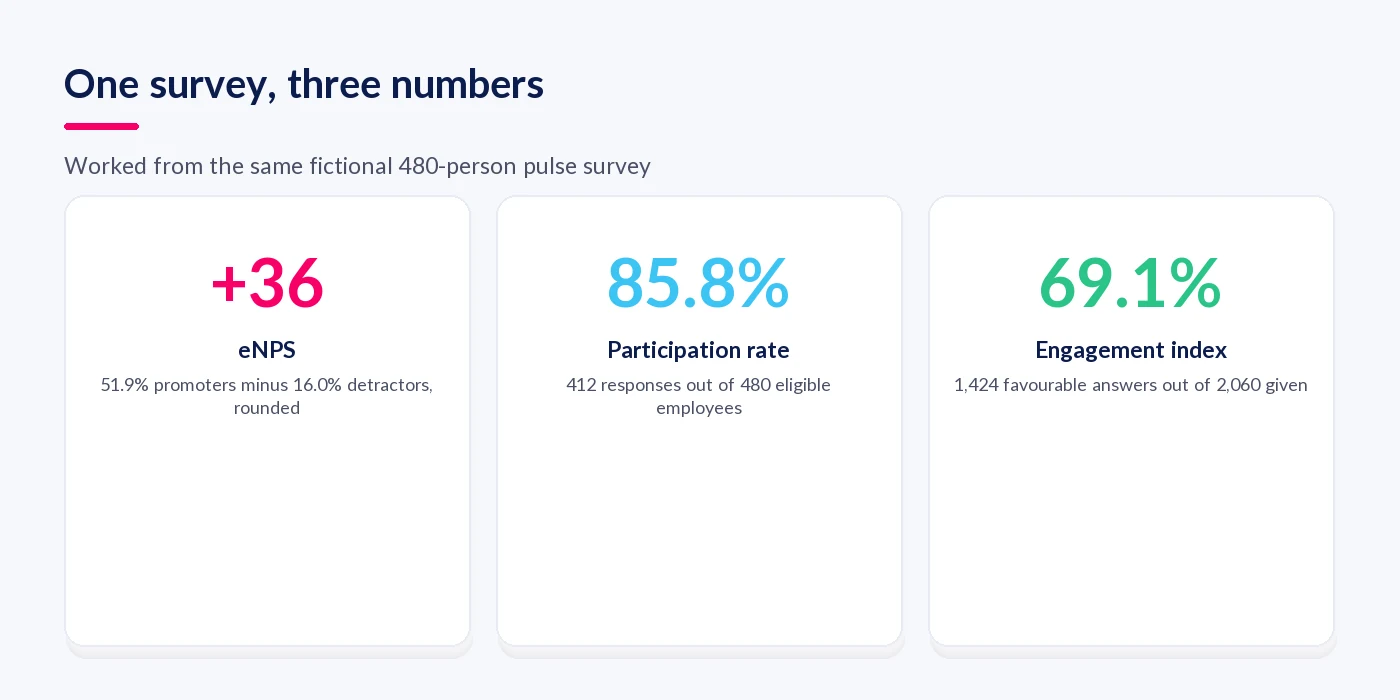
Each is a one-line formula. To make them concrete, all three are worked below from the same fictional survey: an organisation with 480 eligible employees, of whom 412 responded. Nothing here needs a statistician, and any tool that will not show you the arithmetic behind its dashboard should be treated with suspicion.
1. Participation rate. The proportion of eligible employees who responded. Use eligible employees, not total headcount — long-term absent and pre-start staff are not a participation failure.
- Formula: responses ÷ eligible employees × 100
- Worked: 412 ÷ 480 × 100 = 85.8%
2. eNPS (employee net promoter score). Ask one question — how likely are you to recommend this organisation as a place to work, on a scale of 0 to 10 — then group the answers. Scores of 9 and 10 are promoters, 7 and 8 are passives, and 0 to 6 are detractors. Passives are counted in the denominator but not in the result.
- Formula: % promoters − % detractors
- Worked: 214 promoters, 132 passives, 66 detractors, from 412 responses
- % promoters = 214 ÷ 412 × 100 = 51.9%
- % detractors = 66 ÷ 412 × 100 = 16.0%
- eNPS = 51.9 − 16.0 = +35.9, reported as +36
The result is a number between −100 and +100, not a percentage, which is why it is written with a sign. One detractor moving to promoter shifts the score by twice as much as one passive moving to promoter — an eNPS can therefore jump without most people changing their minds about anything.
3. Engagement index. Pick a small fixed set of agreement statements — five works well — on a 1 to 5 scale, and count answers of 4 or 5 as favourable. The index is the share of favourable answers across every item and every respondent.
- Formula: favourable answers ÷ (items × respondents) × 100
- Worked: favourable counts per item of 331, 288, 240, 355 and 210 = 1,424 favourable answers
- Denominator = 5 items × 412 respondents = 2,060 answers
- Index = 1,424 ÷ 2,060 × 100 = 69.1%
Then read the items individually, because the index hides the finding. In this example the strongest item scores 355 ÷ 412 = 86.2% favourable and the weakest scores 210 ÷ 412 = 51.0%. The 35-point gap between them is the thing to act on; the 69.1% headline is only there to trend.
| Metric | Formula | Worked answer | What it is good for | Where it misleads |
|---|---|---|---|---|
| Participation rate | Responses ÷ eligible employees × 100 | 412 ÷ 480 = 85.8% | Judging whether any other number can be trusted | Ignoring which groups did not respond — usually the least engaged |
| eNPS | % promoters (9–10) − % detractors (0–6) | 51.9 − 16.0 = +36 | One headline figure a board will remember and trend | Volatile at small team sizes; hides why anyone answered as they did |
| Engagement index | Favourable answers ÷ (items × respondents) × 100 | 1,424 ÷ 2,060 = 69.1% | Comparing teams and tracking drivers over time | Averages a strong item and a weak one into a meaningless middle |
| Item-level favourability | Favourable answers for one item ÷ respondents × 100 | 210 ÷ 412 = 51.0% | Deciding what to actually change | Over-reading a single item's movement between two cycles |
Two rules on reporting. Never publish a team-level figure for a team small enough that people can identify each other's answers — five responses is a common floor. And always publish the participation rate next to the score, because an index of 69.1% from a third of the workforce is not the same finding as the same index from 85.8%.
How to assess employee engagement
Assessment is broader than measurement: it means checking whether the survey score is telling the truth, by testing it against behaviour and against what people say in conversation. A score is one source. Absence, voluntary turnover, internal moves, overtime and the follow-through rate on previous commitments are four more, and you already hold all of them.
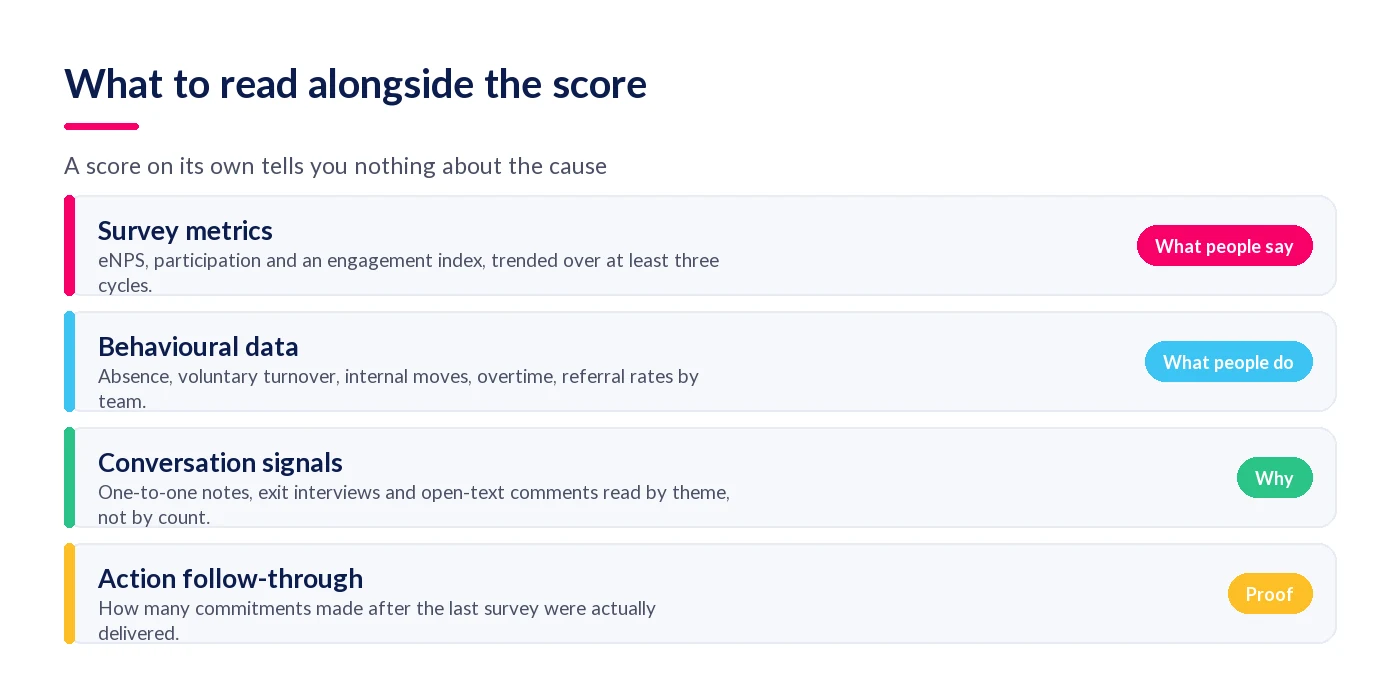
- Survey metrics — the three numbers above, trended across at least three cycles so you can separate a trend from noise.
- Behavioural data — absence, voluntary turnover, internal moves, overtime and referrals, broken down by team. UK sickness absence averaged 2.0% of working hours in 2024 according to ONS data, which gives you a national line to compare against.
- Conversation signals — one-to-one notes, exit interviews and open-text comments read by theme rather than counted. Ten comments naming the same rota problem is a finding; a word cloud is not.
- Action follow-through — how many commitments made after the last survey were actually delivered. This is the best single predictor of whether your next survey will be answered honestly.
On question design, use a validated item set if you can. Gallup's Q12 items are the best-known example and have decades of published research behind them, though they are proprietary and cannot be reproduced or administered without Gallup's written consent — so either licence them or write your own carefully. Our guide to designing an employee engagement survey covers how to write items that survive contact with a real workforce.
How often should you measure employee engagement?
Quarterly is the workable default for most mid-sized organisations: frequent enough that a change shows up while you can still act on it, infrequent enough that you have time to do something between cycles. Annual is too slow to manage by and gives you one data point a year. Monthly is only sustainable if the survey is genuinely three questions long.
The real constraint is not survey fatigue, it is action fatigue. People do not get tired of being asked; they get tired of being asked and ignored. If you cannot deliver and publish one visible action per team between cycles, lengthen the cycle rather than shortening the survey.
Frontline and shift-based workforces need a different cadence and a different channel — a three-question pulse on a phone at shift handover, not a 40-item census emailed to an address nobody has. Our ebook Deskless Not Voiceless: How to Engage Frontline Employees covers reaching those teams at all, and the cost of running any of this is broken down in how much employee engagement surveys cost.
For context on where a good score sits, Gallup's UK country data put engagement at 10% of employees in 2025 against 20% globally — a reminder that your own figures will look worse than the vendor case studies, and that the trend matters more than the absolute.
StaffCircle calculates all three metrics continuously — real-time eNPS, pulse surveys and sentiment analysis by team — so the arithmetic above happens without a spreadsheet. Customers see 74% higher employee engagement, measured as documented on our customer outcomes page. Once you have the baseline, how to improve employee engagement covers what to do with it.
To see engagement measured and acted on in one place, take a look at StaffCircle's employee engagement software.
Frequently asked questions
What is a good eNPS score?
Any positive eNPS means you have more promoters than detractors, which is a reasonable floor. Beyond that, comparisons are only meaningful against your own previous score or a sector panel, because eNPS varies enormously by industry and by how the question is asked. Trend beats benchmark.
What is a good employee engagement survey response rate?
Judge it against your own last cycle rather than an external number. What matters more than the headline is which groups did not respond: if participation is high at head office and low on shift, your score describes head office. Always publish the participation rate next to the result.
What is an employee engagement index?
An engagement index is the share of favourable answers across a fixed set of agreement statements. Count answers of 4 or 5 on a 1 to 5 scale as favourable, then divide favourable answers by items multiplied by respondents. It is a trend line, not a verdict on any single team.
How do you measure engagement without a survey?
Use behavioural data you already hold: voluntary turnover, sickness absence, internal moves, overtime and referral rates, all broken down by team. Add the follow-through rate on commitments managers made to their teams. This tells you where a problem is, though rarely why, which is what a survey adds.
How many questions should an engagement survey have?
Between five and fifteen for a regular pulse, and no more than 30 for an annual census. Every item you add should answer a question you can name before you send it. Length is the main reason frontline and shift-based employees abandon a survey partway through.
Related articles

See StaffCircle in action
Book a personalised demo and see how StaffCircle drives performance, engagement and development.