How to write OKRs (with examples)
The way to write an OKR is to name one qualitative objective, then attach two to five key results that each move a number from a baseline to a target with a named source. Write the objective first, keep every number out of it, and label the OKR committed or aspirational.
Key facts
- Write the objective first; it should contain no numbers.
- Every key result needs a baseline, a target and a source.
- Key results measure outcomes; project milestones are not key results.
- Google recommends three to five objectives, about three key results each.
- Label each OKR committed or aspirational before the quarter starts.
How to set OKRs
Setting OKRs is a six-step drafting process, and the order matters: the objective comes before the measures, and the measures come before any conversation about targets. Most unusable OKRs are the result of jumping straight to numbers the team already reports, which produces a dashboard rather than a set of priorities. Google's re:Work guide to setting goals with OKRs recommends three to five objectives with about three key results each, and that ceiling is easier to hold if you draft in this order. If you need the format itself first, start with what an OKR is and how it is scored.
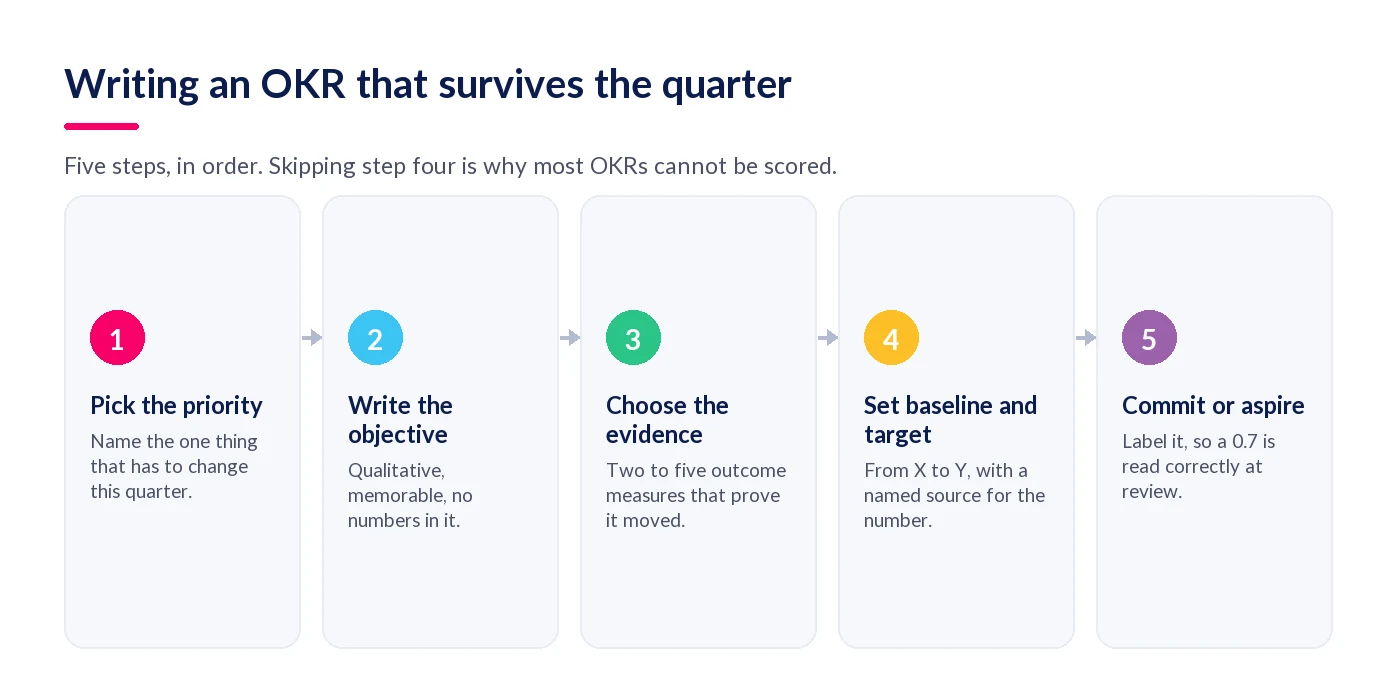
- Pick the one thing that has to change. Start from the priority, not the template. Name the single outcome that would make this quarter worth reporting, and check nobody else already owns it. If you cannot argue for it over the other candidates, it is not an objective yet.
- Write the objective in plain language. One sentence, qualitative, no numbers. It should be repeatable from memory and specific enough that an outsider could tell why it matters. If it would fit any quarter of any year, rewrite it.
- Choose two to five key results that prove it. Ask what would have to be measurably different for the objective to be true. Each key result must be an outcome rather than a deliverable, and one of them should make gaming the others visible.
- Give every key result a baseline, a target and a source. Write each as from X to Y, and name the report the number comes from. A key result with no baseline cannot be scored, and a key result with no named source will be argued about in week 13.
- Label the OKR committed or aspirational. Committed OKRs are expected to land at 1.0. Aspirational OKRs carry an expected average score of about 0.7. Deciding which one you are writing before the quarter starts is what makes the score readable afterwards.
- Publish it and set the check-in rhythm. Put the OKR where other teams can see it, name one owner per key result, and agree a weekly or fortnightly update. An OKR nobody updates for six weeks is rebuilt from memory at quarter end.
Step five is the one teams argue about, so it is worth being precise. Google's OKR Playbook, published by John Doerr's What Matters, separates committed OKRs — agreed deliverables where the expected score is 1.0 and a miss requires an explanation — from aspirational OKRs, which describe an outcome the team has no clear route to yet and carry an expected average score of 0.7 with high variance. The label is what makes the score readable three months later.
What are examples of OKRs by function?
The fastest way to learn the wording is to read OKRs that are already properly formed. Below are 13 worked examples across sales, HR and people, product, marketing and operations. The figures are illustrative rather than benchmarks, so change them to your own baselines — but keep the shape, because every key result names a starting point, a target and the report the number will be read from.
| Function | Objective | Key results (baseline to target, with source) |
|---|---|---|
| Sales | Make our mid-market segment the most predictable part of the pipeline | Stage-2 to closed-won conversion from 18% to 26% (CRM); average sales cycle from 74 to 55 days (CRM); qualified mid-market opportunities from 40 to 65 per quarter (CRM) |
| Sales | Stop losing the renewals we should never lose | Gross renewal rate from 86% to 93% (billing system); renewals closed in the final week from 61% to 25% (CRM); pre-renewal reviews completed from 0 to 30 (CRM tasks) |
| Sales | Build a pipeline that does not depend on three people | Share of pipeline sourced by the top three reps from 68% to 45% (CRM); reps at or above quota from 4 of 11 to 8 of 11 (commission report); self-sourced meetings from 30 to 70 per quarter (CRM) |
| HR and people | Make the first 90 days the reason new starters stay | 90-day new-starter retention from 84% to 92% (HRIS leaver report); new starters with a completed 30-day check-in from 41% to 95% (check-in report); day-45 onboarding score from 6.8 to 8.5 (onboarding pulse) |
| HR and people | Give every manager the confidence to run a hard conversation | Managers completing the feedback programme from 22% to 80% (LMS); reports agreeing their manager gives useful feedback from 54% to 70% (engagement survey); overdue one-to-ones from 310 to under 40 (performance platform) |
| HR and people | Close the two skills gaps that keep blocking delivery | Employees with a mapped skill profile from 35% to 88% (skills matrix); roles with named cover from 12 to 28 (succession report); internal fill rate for open roles from 19% to 35% (ATS) |
| Product | Make the first session prove the product's value | Day-one activation from 34% to 55% (product analytics); median time to first report from 26 to 8 minutes (product analytics); week-four retention from 41% to 52% (product analytics) |
| Product | Stop shipping features nobody adopts | 30-day adoption of the last three releases from 11% to 30% (product analytics); discovery interviews per release from 2 to 8 (research log); features retired from 0 to 5 (release notes) |
| Marketing | Turn organic search into our largest source of qualified demand | Non-brand organic sessions from 12,400 to 22,000 per month (GA4); organic-sourced MQLs from 60 to 140 per quarter (CRM); target terms ranking in the top ten from 9 to 30 (rank tracker) |
| Marketing | Make the webinar programme earn its place in the budget | Registrant-to-attendee rate from 38% to 55% (webinar platform); attendee-to-opportunity rate from 3% to 8% (CRM); cost per opportunity from £1,450 to £800 (finance report) |
| Operations | Make delivery dates something customers can trust | On-time delivery from 82% to 95% (ERP despatch report); average days late on missed orders from 6.2 to 2.0 (ERP); rescheduled jobs per month from 48 to 15 (planning system) |
| Operations | Take the manual work out of month-end | Close time from 11 to 5 working days (finance calendar); manual journal entries from 240 to 60 per month (ledger); restatements from 3 to 0 (audit log) |
| Operations | Make support the reason customers renew | First response time from five hours to one hour (service desk); first-touch resolution from 44% to 65% (service desk); customer satisfaction from 7.1 to 8.6 (post-ticket survey) |
Read down the objective column and none of them contains a number. Read across the key results and every one does. That is the single most useful pattern to copy, and it is what separates these from the goal lists most organisations already have sitting in a spreadsheet.
If those objectives will be discussed in appraisals as well as quarterly reviews, The Ultimate Guide to Performance Reviews covers how to bring goal evidence into the conversation without collapsing the two processes into one.
How to use KPIs and OKRs
KPIs and OKRs answer different questions, so they belong side by side rather than in competition. A KPI is a continuing health measure with a threshold — first response time under two hours, gross margin above 62% — that runs every quarter whether or not anyone is trying to change it. A key result is a deliberate change to one of those numbers inside a single cycle, expressed as a move from a baseline to a target, and it retires or resets when the cycle ends.
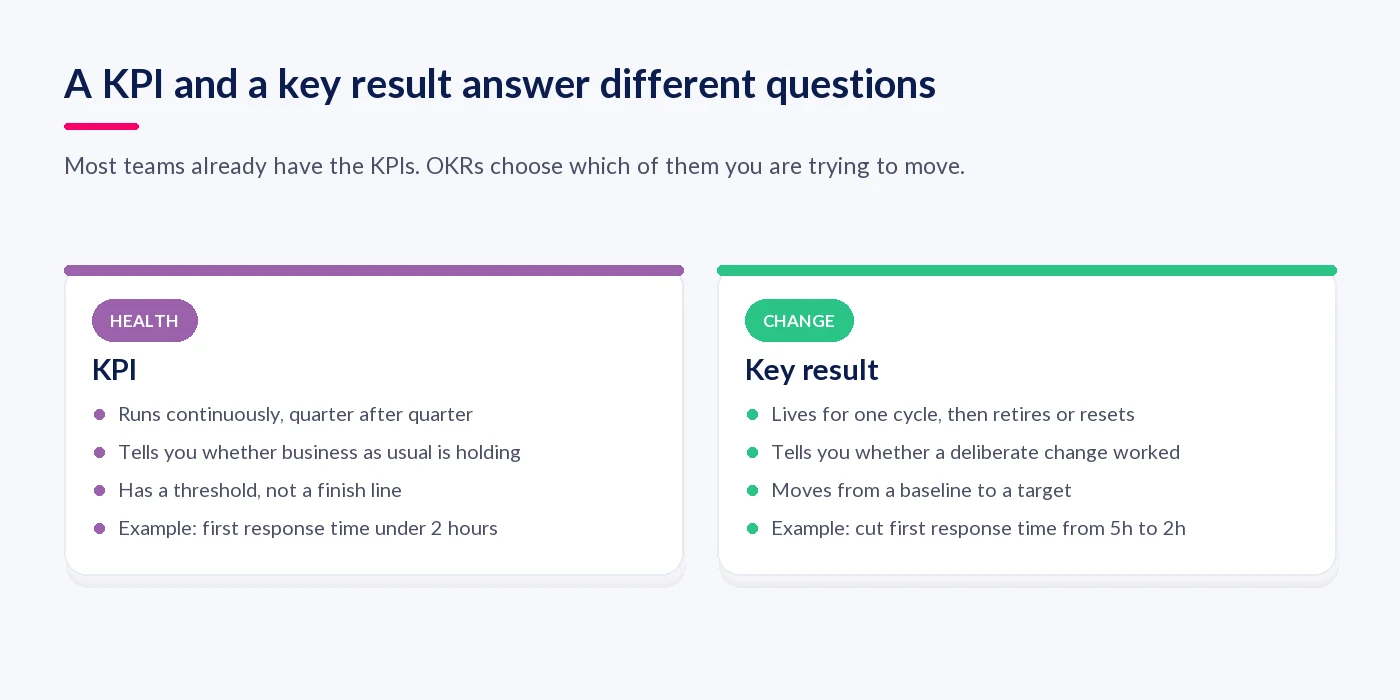
In practice the KPI set is your candidate list for key results. Review the KPIs at the start of planning, pick the two or three that must move for the objective to be true, and leave the rest alone as monitoring. The mistake is promoting every KPI into a key result, which produces twenty measures, no priorities and a quarterly score that means nothing.
One warning about thresholds. A KPI that is already healthy makes a poor key result, because you score 1.0 for standing still. If a KPI is at target and you want it in the OKR, write the key result as raising the floor — worst-week performance rather than average performance.
What makes a key result measurable?
A key result is measurable when three things are written down: where the number is today, where it needs to be by the end of the cycle, and which report it will be read from. Miss the baseline and you cannot calculate a score. Miss the source and the score becomes a negotiation. Miss the target and any movement at all counts as success.
Measurable is not the same as SMART, though the two overlap. The SMART test is the right way to pressure-test an individual key result once drafted — our guide to what SMART objectives are, with examples sets out how to apply it, and it is the most useful companion tool to OKRs for teams that have never written measurable goals before.
Two forms are worth avoiding. Milestone key results (launch the portal, hire the analyst) are tasks that happen to have dates; they are usually work in service of a real key result rather than the key result itself. Composite key results — a single index built from four other numbers — are technically measurable but nobody can tell what changed when the score moves.
How do you know an OKR is ready to publish?
Before an OKR goes live, it should survive a short readiness check. This is the step teams skip, and it is cheaper to fail here than in week 13 when the number cannot be found. Run each drafted OKR against the following seven questions, and rewrite anything that fails.
- Is the objective free of numbers? If not, it is a key result wearing the objective's clothes.
- Could a colleague in another team say why it matters? If not, it is internal jargon.
- Does every key result have a baseline? Without one, there is no score.
- Does every key result name a report? Whoever owns that report should know it is now load-bearing.
- Is each key result an outcome rather than a deliverable? Shipping a thing is not the same as changing a number.
- Does one key result make gaming the others visible? Single-measure OKRs invite exactly the behaviour you did not intend.
- Is it labelled committed or aspirational? A 0.7 is either a success or a miss depending on the label.
Once the wording holds up, the harder question is the operating rhythm around it — who updates what, how often, and what happens at quarter end. Our guide to how to implement OKRs across a company covers the rollout, and our guide to building a performance management system shows where OKRs sit alongside reviews and one-to-ones.
Well-written OKRs are worth very little if updating them is somebody's Friday afternoon job, which is why StaffCircle's performance management and development platform keeps objectives, key results, check-ins and scores on the same record as the review they feed.
Frequently asked questions
How do you write a good objective?
Write it as one sentence describing the outcome you want, with no metric inside it, and make it specific enough that somebody outside the team would understand why it matters. If it could apply to any quarter of any year, it is too generic to guide a decision.
How do you write a measurable key result?
Use the from-X-to-Y form: state the current baseline, the target for the end of the cycle, and where the figure comes from. Cut first response time from five hours to one hour, measured in the service desk report, is scoreable. Improve response times is not.
What is an example of a good OKR?
Objective: make the first 90 days the reason new starters stay. Key results: 90-day retention from 84% to 92%; new starters with a completed 30-day check-in from 41% to 95%; day-45 onboarding score from 6.8 to 8.5. Qualitative objective, three outcome measures, all sourced.
Should OKRs be written top-down or bottom-up?
Both, in that order. Company objectives are set first, because teams cannot align to something that does not exist yet. Teams then draft their own objectives and key results against them, which is where the useful argument happens: about which measures actually move the company objective.
Can a key result be qualitative?
Not really. A key result has to be gradeable at the end of the cycle, so it needs a number. If the outcome is genuinely qualitative — better internal communication, say — find the measurable proxy you would accept as evidence, such as a survey score with a baseline and target.
Related articles
See StaffCircle in action
Book a personalised demo and see how StaffCircle drives performance, engagement and development.