How to calculate employee retention rate
The employee retention rate is the percentage of the people you employed at the start of a period who were still employed at the end of it. Divide the number who stayed by your opening headcount, then multiply by 100. New starters are excluded from both figures.
Key facts
- Retention rate counts only the people who were employed at the start of the period.
- New starters never appear in the calculation, in the numerator or the denominator.
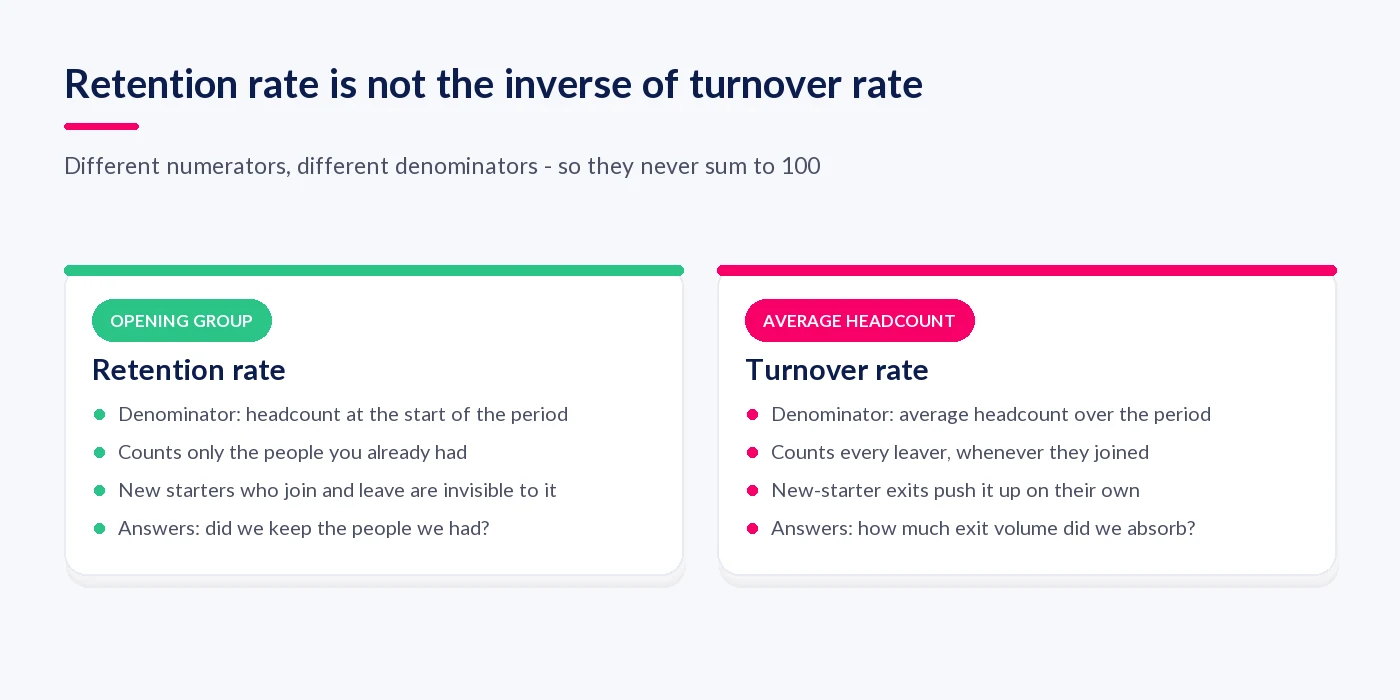
- Retention rate and turnover rate use different denominators, so they never sum to 100.
- A retention rate above 100% is impossible. If you get one, your denominator is wrong.
- Segment retention by team, tenure band and first-year cohort before acting on it.
How do you calculate employee retention rate?
Take the number of employees on your payroll at the start of the period, count how many of those same people are still employed at the end of it, divide the second figure by the first and multiply by 100. Anyone who joined during the period is left out of both numbers. That single exclusion is what makes retention rate a clean measure of whether you kept the workforce you already had.
| Measure | Formula | Denominator | Counts new starters who left? |
|---|---|---|---|
| Retention rate | (Opening headcount − leavers from that opening group) ÷ opening headcount × 100 | Opening headcount, a fixed number | No |
| Turnover rate | Total leavers in the period ÷ average headcount × 100 | Average headcount, usually (opening + closing) ÷ 2 | Yes |
The process below is the version worth writing into your reporting pack, because it forces the two decisions people get wrong: freezing the opening group before you start, and recording leavers separately rather than inferring them.
- Fix the period and freeze the opening headcount. Choose the window, then take a dated list of everyone employed on day one. A list, not a number. You will need the names later to work out which leavers belonged to the opening group.
- Count how many of those same people are still employed at the end. Match the closing payroll against your opening list. People who changed role, team or contract type still count as retained, because they are still employed.
- Exclude every new starter from both figures. Anyone who joined after day one is out of scope, including anyone who joined and left within the period. Their exits belong in your turnover figure, not in your retention figure.
- Divide, multiply by 100, and record the leavers separately. Log the leavers from the opening group as their own number and split them into voluntary and involuntary. Without that split, the percentage tells you nothing you can act on.
- Segment before you act on it. Rerun the same calculation by team, by tenure band, and as a first-year cohort. The organisation-wide figure hides the two problems that are actually fixable.
What is the difference between retention rate and turnover rate?
Retention rate and turnover rate are not two views of the same number, and subtracting one from 100 does not give you the other. They differ in both the numerator and the denominator. Retention counts only exits from the opening group and divides by the opening headcount; turnover counts every exit in the period and divides by average headcount. Most published guidance on this topic conflates the two, and it is the single most common reporting error in retention data.
Two worked examples make the gap concrete. Both businesses start the year with exactly 200 people.
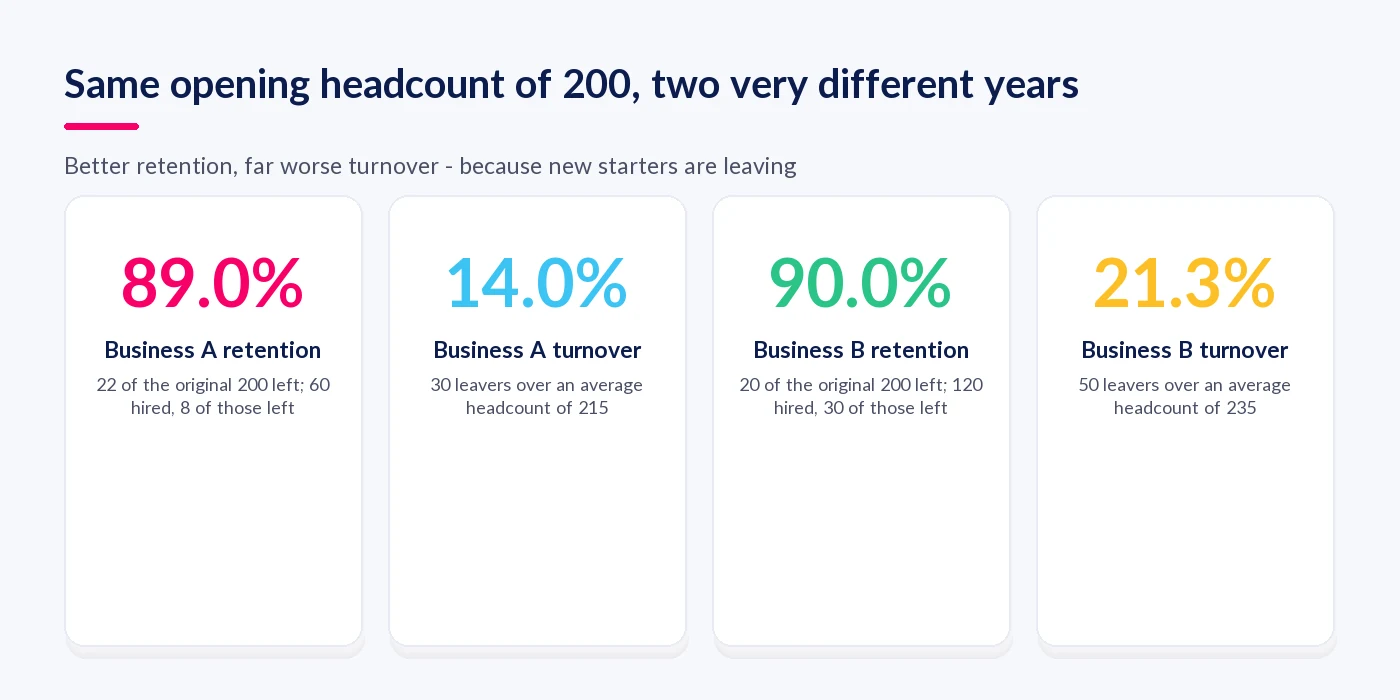
Business A. During the year it hires 60 people and 30 people leave: 22 from the original 200, plus 8 new starters who joined and left inside the same year. Closing headcount is 230, so average headcount is (200 + 230) ÷ 2 = 215.
- Retention rate = (200 − 22) ÷ 200 × 100 = 178 ÷ 200 = 89.0%
- Turnover rate = 30 ÷ 215 × 100 = 14.0%
- 100 − 89.0 = 11.0, not 14.0. Three percentage points of exit volume are invisible to the retention rate.
Business B. Same opening headcount of 200, but a much heavier hiring year: 120 hires and 50 leavers, of whom only 20 came from the original 200 and 30 were new starters who did not last the year. Closing headcount is 270, so average headcount is 235.
- Retention rate = (200 − 20) ÷ 200 × 100 = 180 ÷ 200 = 90.0%
- Turnover rate = 50 ÷ 235 × 100 = 21.3%
Business B has better retention than Business A and turnover half again as high. Anyone reading only the retention rate would conclude B was the more stable employer. Anyone reading only the turnover rate would conclude the opposite. Both would be reporting something true and drawing the wrong conclusion.
There are exactly two reasons the two measures diverge, and it is worth being able to state both:
- The numerators count different exits. Retention can only ever count leavers who were in the opening group. Every new starter who joins and leaves inside the period is counted by turnover and is structurally invisible to retention. In Business B that is 30 people, which is 60% of all its leavers.
- The denominators are different numbers. Retention divides by the opening headcount, which is fixed the moment the period begins. Turnover divides by average headcount, which rises as soon as you hire. The faster you grow, the further apart the two measures drift even with identical leaver counts.
The practical consequence: report both, and never present one as a proxy for the other. Retention alone flatters a business with an early-tenure problem. Turnover alone makes a fast-growing business look unstable when its established workforce is perfectly settled. If your reporting currently derives one from the other, the numbers in your board pack are wrong. Our guide to attrition rate covers the third term in this family, which carries its own distinct definition again.
What does the calculation look like at 50, 250 and 1,000 people?
The formula does not change with size, but the amount of noise in the answer does. At 50 people, one leaver moves the rate by two percentage points, so a single resignation can look like a trend. The table below runs the same proportional pattern of hiring and leaving through three headcounts, so you can see the shape of the numbers and use the nearest row as a sense-check on your own.
| Opening headcount | Hires in the year | Leavers from the opening group | New starters who left | Closing headcount | Average headcount | Retention rate | Turnover rate | Gap vs 100 − retention |
|---|---|---|---|---|---|---|---|---|
| 50 | 15 | 6 | 2 | 57 | 53.5 | 88.0% | 15.0% | 3.0 points |
| 250 | 75 | 28 | 10 | 287 | 268.5 | 88.8% | 14.2% | 3.0 points |
| 1,000 | 300 | 110 | 40 | 1,150 | 1,075 | 89.0% | 14.0% | 3.0 points |
The gap column is the point of the table. It stays at three percentage points across all three rows because the pattern of hiring and early leaving is held constant. The gap is driven by behaviour, not by size, so a small business with a new-starter problem will show exactly the same distortion as a large one. If you want to model what that exit volume is costing you in cash rather than percentages, our ROI calculator puts numbers against turnover, productivity and manager time.
What is a good employee retention rate?
There is no universal target, because the honest benchmark is your own sector and your own last three years. For context on the national picture, CIPD analysis of ONS Annual Population Survey data found that average staff churn across UK workers was 34% between January 2022 and December 2023, split into 27.4% who moved to a new employer and 6.6% who were not working a year later. The same analysis puts sector variation between 25% in public administration and defence and 52% in hospitality, so a rate that would be alarming in one industry is unremarkable in another.
Three tests are more useful than any single benchmark:
- Direction over three years. A retention rate of 84% that has risen from 79% is a healthier signal than 90% falling from 95%.
- First-year retention specifically. If your overall rate is respectable but your first-year cohort is losing a quarter of its starters, you have a hiring or onboarding problem wearing a retention rate as a disguise.
- Retention in the roles you cannot replace quickly. Losing four people from a forty-person team of interchangeable roles is a different problem from losing your only two qualified specialists.
What the rate cannot tell you is whether the right people stayed. A team that keeps everyone but promotes nobody is not a success. Pairing retention with internal mobility, and with a view of who is genuinely ready for the next role, is what makes the number decision-grade. That is the connection between retention data and employee productivity: the cost of a departure is mostly the output you do not get while a replacement gets up to speed.
How StaffCircle keeps the number current
Calculating retention once a year in a spreadsheet is manageable. Calculating it monthly, by team, by tenure band and by role criticality, with the leaver reasons attached, is where it becomes a job nobody has time for. StaffCircle holds performance, skills and movement data on one record, so segmented retention comes out of live data rather than a reconciliation exercise, and the leaver reasons sit next to the review history that preceded them.
Customers report 57% lower employee turnover, and that page sets out exactly what the figure measures and how it is calculated. The mechanism behind it is not the reporting: it is closing the capability and progression gaps the reporting exposes, which is what the skills and development module is for.
Final thoughts
Calculating employee retention rate is arithmetic. Calculating it correctly means freezing the opening group, excluding new starters, and never treating 100 minus retention as your turnover rate. Report both measures, segment by tenure and by role criticality, and read the direction of travel rather than the single figure. Once the number is right, the useful work starts: understanding what each departure costs, deciding which interventions to run first, and being clear on what retention actually means when you present it.
To see segmented retention, skills gaps and review history on one record, book a demo.
Frequently asked questions
How do you work out a monthly employee retention rate?
Use the same formula over a shorter window: take headcount on the first of the month, count how many of those same people are still employed on the last day, divide and multiply by 100. Monthly figures are volatile in small teams, so read them as a rolling twelve-month average.
Should fixed-term and seasonal staff be included?
Include them only if you report them separately. A seasonal contract ending on schedule is not a retention failure, so mixing those exits into one figure makes the headline number meaningless. Most organisations report permanent-employee retention as the headline and fixed-term completion as a second line.
Do internal promotions count as leavers?
No. Retention measures whether someone is still employed by the organisation, not whether they hold the same job. Someone promoted or moved to another department has been retained. Count internal moves separately as internal mobility, because a healthy mobility rate usually sits behind a healthy retention rate.
What retention rate should you report to the board?
Report three numbers, not one: overall annual retention, first-year retention, and retention in your critical roles. The overall figure alone hides both of the problems a board can act on, which are losing new starters before they are productive and losing the handful of people who are hardest to replace.
How do you calculate first-year retention?
Take everyone who started in a given twelve-month window, then check how many were still employed twelve months after their own start date. Divide by the size of that starting cohort and multiply by 100. This is a cohort measure, so each intake is tracked on its own clock.
Related articles



See StaffCircle in action
Book a personalised demo and see how StaffCircle drives performance, engagement and development.