What is a skills matrix?
A skills matrix is a grid that maps the people in a team against the skills that team needs, with a rating in every cell showing the level each person holds. Read down a column and you see coverage for one skill; read across a row and you see one person's profile.
Key facts
- Rows are people, columns are skills, and every cell holds a rating.
- A column with only one person at the required level is a single point of failure.
- Set the required level for each role before rating anybody.
- Three or four rating levels is enough; five invites false precision.
- One team, one matrix. Organisation-wide grids collapse under their own weight.
What is a skills matrix used for?
A skills matrix is used to answer four operational questions at once: who can cover which work, where the team is one absence away from a problem, who is ready for more, and what to train next. It is a planning instrument for a manager, not a reporting exercise for HR, which is why it works best at team scale.
The four uses in order of how often they actually get used:
- Cover and resilience. Any skill where only one person meets the required level is a risk you can now name and schedule against.
- Work allocation. Assign by demonstrated level rather than by who answered first.
- Development planning. The distance between a person's current level and the level their role requires is their plan, already written.
- Recruitment briefs. A gap that appears across an entire column is a hiring requirement, not a training one.
A skills matrix is deliberately narrow. It records levels held against skills needed for one team. The organisation-wide version of the question, which capabilities are we short of and what should we do about it, is skills gap analysis, and this page is designed to sit alongside that guide rather than repeat it.
What should be included in a skills matrix?
A skills matrix needs five things: the people, the skills, a defined rating scale, the required level for each role, and a date. Most matrices that fall out of use are missing the last two, which is what turns a planning tool into an unexplained grid of numbers nobody trusts.
Take them in turn. People: one row each, with their role named, because the required level follows the role rather than the person. Skills: eight to fifteen, named as things people do rather than as topics, so "handles escalation calls" instead of "communication". A rating scale: three or four levels, each defined in observable terms. Required levels: what each role needs, agreed before anybody is rated. A date: a matrix with no date is untrustworthy within six months.
Here is a working four-level scale. Copy it, or replace the wording, but define it somewhere the team can see:
| Level | Label | What it means in practice | Who confirms it |
|---|---|---|---|
| 0 | None | No exposure to this skill yet. | Nobody needed. |
| 1 | Learning | Can do it with someone checking the work. | Whoever is checking it. |
| 2 | Independent | Does it unsupervised at the normal standard and speed. | Line manager, from observed work. |
| 3 | Can teach it | Handles the difficult cases and trains other people. | Line manager plus one person they have trained. |
Where the skill names should come from is the role standard, if you have one. If you do not, a competency framework is the thing that supplies them consistently across teams, and without it every manager will name skills differently and the matrices will not aggregate.
What does a completed skills matrix look like?
It looks like the grid below: a required-level row per role, then one row per person, with a rating in each cell and a coverage count at the foot. This is a real worked example for a six-person client services team, using the 0 to 3 scale defined above. The interesting information is at the bottom of the columns, not in the middle of the grid.
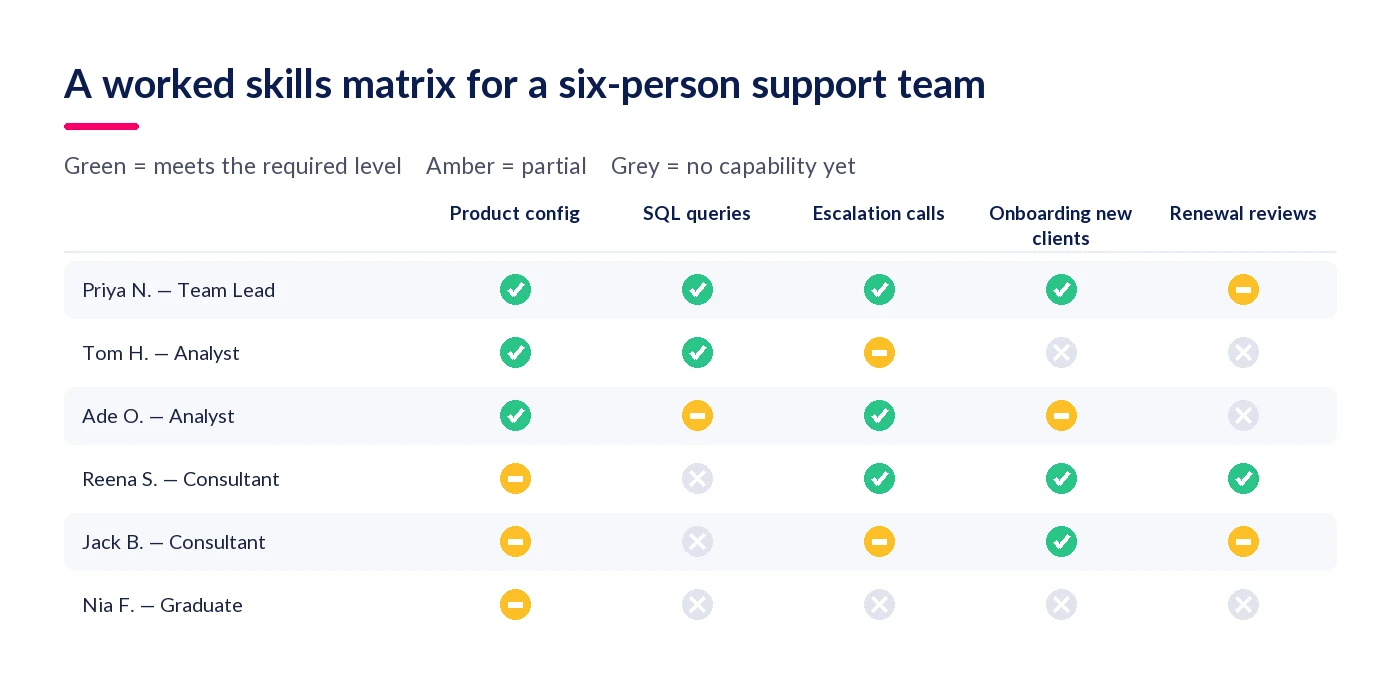
| Team member (role) | Product configuration | SQL reporting | Escalation handling | Client onboarding | Renewal reviews |
|---|---|---|---|---|---|
| Required — Analyst | 2 | 2 | 1 | 0 | 0 |
| Required — Consultant | 2 | 0 | 2 | 2 | 2 |
| Priya N. (Team Lead) | 3 | 3 | 3 | 3 | 2 |
| Tom H. (Analyst) | 3 | 3 | 1 | 0 | 0 |
| Ade O. (Analyst) | 2 | 1 | 2 | 1 | 0 |
| Reena S. (Consultant) | 1 | 0 | 3 | 3 | 3 |
| Jack B. (Consultant) | 1 | 0 | 1 | 2 | 1 |
| Nia F. (Graduate) | 1 | 0 | 0 | 0 | 0 |
| People meeting the required level | 3 of 5 | 2 of 2 | 3 of 5 | 3 of 3 | 2 of 3 |
Four conclusions come straight off that grid, and none of them were visible in a conversation about the team:
- SQL reporting is a single point of failure. Only Priya and Tom hold it at all, and Priya is the team lead, so a fortnight of leave overlapping with month-end leaves nobody. That is a cover problem to schedule this month, not a training theme for next year.
- Jack is below the consultant standard on three of his five skills. That is a specific, evidenced development plan rather than a vague conversation about confidence.
- Reena is over-levelled on renewals and under-levelled on configuration. The fastest fix is Reena and Tom teaching each other, not a course for either.
- Nia is exactly where a graduate should be. A row of ones and zeros in month two is not a red flag, which is why the required-level rows matter: without them, every junior looks like a gap.
This is also the pattern behind skills-based talent management at scale. Iglu used StaffCircle to move to role-based skills and competency records rather than spreadsheets, and their skills-based talent management case study covers what changed in practice.
How do you create a skills matrix?
Create it in six steps, in this order: pick one team, list the skills that matter, set the rating scale, set the required level per role, rate and verify, then read the gaps. The order matters, because setting required levels after rating people is how a matrix ends up justifying the ratings rather than testing them.
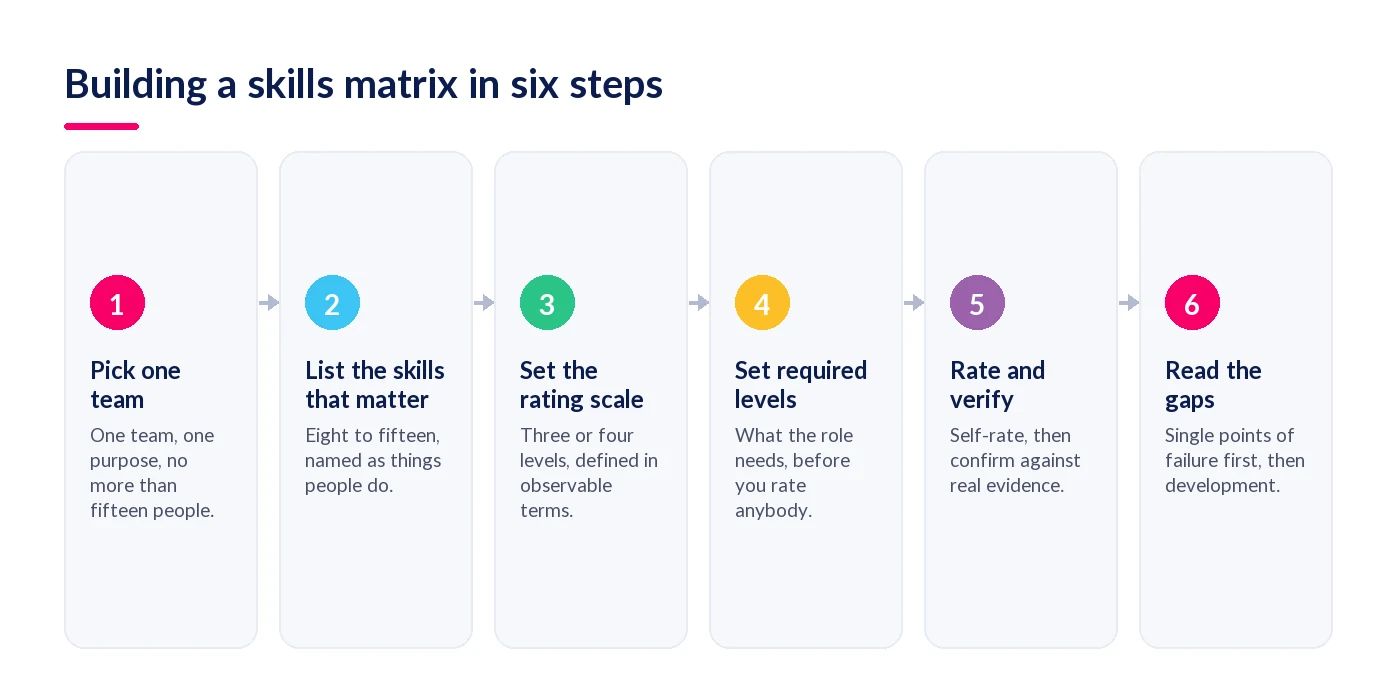
- Pick one team with one purpose. Up to about fifteen people. Beyond that the grid stops fitting on a screen and stops being used, and a matrix that is not looked at is worse than none.
- List eight to fifteen skills, named as things people do. Ask the manager which skills the team's work actually depends on this year. Drop anything nobody would ever staff against.
- Define the rating scale before anyone uses it. Three or four levels, each described in observable terms. Undefined scales produce ratings that mean different things in different rows.
- Set the required level for each role. Do this before rating people, and do it with the manager. This is the step that turns the matrix from a scoreboard into a gap analysis.
- Rate, then verify. Ask people to self-rate, then confirm each rating against something real: work you have seen, a completed assessment, a customer outcome. Where the two disagree, the conversation is the point.
- Read the gaps in column order, not row order. Single points of failure first, then role gaps, then development opportunities. Columns tell you about risk; rows tell you about people.
If the matrix is feeding a succession conversation rather than a rota, the Succession Planning Guide with free customisable templates covers the templates for that next step.
What is the difference between a skills matrix and a skills gap analysis?
A skills matrix is the picture; a skills gap analysis is what you do with it. The matrix records who holds which skill at what level in one team. The gap analysis compares current capability against what the organisation will need, prioritises the shortfalls and produces a plan. One is an instrument, the other is a process.
In sequence: build the matrix, then run the analysis. Skipping straight to analysis means reasoning about capability from impressions, and building matrices without ever analysing them produces tidy grids and no decisions. Our full guide to skills gap analysis covers the second half, including prioritising gaps and choosing between training, hiring and redesigning the role.
Two related distinctions are worth keeping straight. A skills matrix is not a 9-box grid, which plots performance against potential for succession rather than skills against people. And a matrix is not a framework: a matrix holds ratings for one team, while competency framework examples show the organisation-wide standard those ratings are measured against. Judging what a rating should be in the first place comes back to what makes an employee competent, and the rest of the series sits on the competency framework article index.
Frequently asked questions
How do you develop a skills matrix in Excel?
Put people in rows, skills in columns, and add two rows at the top for required levels by role. Use conditional formatting to colour cells that fall below the required level, and a COUNTIF row at the foot for coverage. Add a date in cell A1, and re-date it every review.
What is the difference between a skills matrix and a competency framework?
A competency framework is the organisation-wide standard: which capabilities matter, defined across proficiency levels. A skills matrix applies that standard to one team, recording where each person currently sits. The framework says what good looks like; the matrix says who is there. You need the framework first for ratings to be comparable.
How many skills should a skills matrix contain?
Eight to fifteen for a single team. Fewer than eight usually misses something the team is actually staffed against; more than fifteen and managers stop maintaining it. If the list keeps growing, you are probably covering two teams with different work and should split the matrix.
Who fills in a skills matrix?
The manager owns it, with each team member self-rating first and the manager confirming or challenging each rating against real evidence. Manager-only matrices miss capability people have never been asked to use. Self-rating-only matrices drift, in both directions, because people calibrate themselves against different bars.
How often should a skills matrix be updated?
Review it quarterly and update it whenever something changes: a joiner, a leaver, a completed assessment, a new system. Annual-only updates mean the grid is out of date for most of the year, and once people spot that, they stop trusting the coverage numbers at the foot of each column.
If you would rather the grid maintained itself from role standards and assessments than live in a spreadsheet, that is what StaffCircle's competency framework tools are built to do.
Related articles
See StaffCircle in action
Book a personalised demo and see how StaffCircle drives performance, engagement and development.